
Popular Posts
How to Use Volatility Ratios Between ATR and Standard Deviation in Trading
Understanding market volatility is fundamental for traders and investors aiming to manage risk effectively and optimize their trading strategies. Among the various tools available, volatility ratios derived from Average True Range (ATR) and standard deviation are particularly valuable. These metrics help quantify how much an asset's price fluctuates over time, providing insights into potential market movements. This article explores how traders can leverage these volatility ratios to improve decision-making in both traditional financial markets and the rapidly evolving crypto space.
What Are ATR and Standard Deviation?
Before diving into their practical applications, it’s essential to understand what ATR and standard deviation represent.
Average True Range (ATR) is a technical indicator developed by J. Welles Wilder in 1978 that measures market volatility by averaging the true range over a specified period—commonly 14 days. The true range considers the greatest of three values: current high minus current low, current high minus previous close, or current low minus previous close. By capturing gaps or sudden price jumps, ATR provides a more comprehensive picture of volatility than simple price ranges alone.
Standard deviation, on the other hand, is a statistical measure that quantifies how much individual data points deviate from the average (mean). In financial markets, it reflects how dispersed prices are around their mean value over a certain period. A higher standard deviation indicates greater variability or risk within that timeframe.
Both metrics serve as vital indicators for assessing market conditions but approach volatility measurement from different angles—ATR focuses on price movement ranges considering gaps; standard deviation emphasizes overall dispersion based on historical data.
Practical Uses of ATR and Standard Deviation in Trading
Traders utilize these tools primarily for risk management, trend analysis, and developing trading strategies:
Market Volatility Assessment: High ATR or standard deviation signals increased uncertainty or rapid price swings—crucial information when deciding whether to enter or exit positions.
Stop-Loss Placement: Many traders use ATR-based stop-loss levels because they adapt dynamically with changing market conditions; wider stops during volatile periods prevent premature exits.
Range Estimation: Standard deviation helps estimate expected price ranges based on historical data—useful for setting profit targets aligned with typical fluctuations.
Trend Confirmation & Reversal Detection: A rising ATR often indicates strengthening trends or impending breakouts; conversely, decreasing values may suggest consolidation phases.
Incorporating both metrics allows traders to develop nuanced views of market behavior rather than relying solely on one indicator type.
Using Volatility Ratios: Combining ATR with Standard Deviation
The core idea behind using ratios between ATR and standard deviation lies in gaining deeper insights into relative versus absolute volatility levels:
Relative Volatility Measurement: Comparing these two metrics can reveal whether recent price movements are unusually large relative to historical norms.
Identifying Market Conditions:
- When ATR exceeds standard deviation, it might indicate heightened short-term activity not fully captured by historical dispersion—potentially signaling upcoming breakouts.
- Conversely, if standard deviation remains high while ATR stays low, this could suggest stable but wide-ranging prices—a sign of sideways markets rather than trending moves.
Volatility Ratio Calculation: Traders often compute ratios like
ATR / Standard Deviationover specific periods (e.g., daily) to monitor shifts:- An increasing ratio suggests growing short-term volatility compared to past variability.
- A decreasing ratio indicates stabilization after turbulent phases.
These ratios serve as early warning signals for adjusting trade sizes or tightening stop-losses accordingly.
Applying Volatility Ratios in Trading Strategies
Integrating these ratios into your trading toolkit can enhance strategy robustness:
Trend Following Adjustments:
- During strong trending periods indicated by rising ATR relative to standard deviation, traders might increase position sizes cautiously because momentum could persist longer.
Mean Reversion Opportunities:
- When the ratio spikes unexpectedly beyond typical levels—and combined with other technical signals—it may signal an overextended move ripe for reversal correction.
Volatility Breakout Triggers:
- Sharp increases in the ratio can precede breakout events; traders may set alerts when thresholds are crossed to prepare entry points ahead of significant moves.
Risk Management Enhancements:
- Dynamic stop-loss placement becomes more precise when considering both absolute (ATR) and relative (ratio) measures—they help avoid false triggers during normal fluctuations while protecting against genuine trend shifts.
In volatile environments like cryptocurrencies where rapid swings dominate daily trading activity since Bitcoin's launch in 2009—and especially during recent years’ surges—the ability to interpret these ratios becomes even more critical for maintaining profitability without exposing oneself excessively to downside risks.
Limitations & Cautions When Using These Metrics
While combining ATR with standard deviations offers powerful insights into market behavior, there are important caveats:
Overreliance on any single indicator—even well-established ones—can lead traders astray if used without context; always incorporate fundamental analysis where relevant.
Market manipulation tactics prevalent especially within crypto markets can artificially inflate perceived volatility metrics leading you astray if not corroborated with other data sources such as volume analysis or news flow.
Regulatory developments impact overall sentiment significantly; sudden policy changes can cause abrupt shifts not immediately reflected through historical volatilities measured by these tools.
Therefore, integrating multiple indicators—including volume patterns, macroeconomic factors—and maintaining disciplined risk controls remain essential components of successful trading strategies involving volatility measurements.
By understanding how ATM/Standard Deviation ratios reflect underlying market dynamics—and applying them thoughtfully—you gain an edge in navigating complex environments characterized by unpredictable swings like those seen recently across global financial assets including cryptocurrencies. Properly leveraging this knowledge enables better timing decisions—from entering trades at optimal moments through managing risks effectively—all grounded firmly within sound analytical principles rooted in transparency and empirical evidence.


JCUSER-WVMdslBw
2025-05-09 10:20
How can you use volatility ratios between ATR and standard deviation?
How to Use Volatility Ratios Between ATR and Standard Deviation in Trading
Understanding market volatility is fundamental for traders and investors aiming to manage risk effectively and optimize their trading strategies. Among the various tools available, volatility ratios derived from Average True Range (ATR) and standard deviation are particularly valuable. These metrics help quantify how much an asset's price fluctuates over time, providing insights into potential market movements. This article explores how traders can leverage these volatility ratios to improve decision-making in both traditional financial markets and the rapidly evolving crypto space.
What Are ATR and Standard Deviation?
Before diving into their practical applications, it’s essential to understand what ATR and standard deviation represent.
Average True Range (ATR) is a technical indicator developed by J. Welles Wilder in 1978 that measures market volatility by averaging the true range over a specified period—commonly 14 days. The true range considers the greatest of three values: current high minus current low, current high minus previous close, or current low minus previous close. By capturing gaps or sudden price jumps, ATR provides a more comprehensive picture of volatility than simple price ranges alone.
Standard deviation, on the other hand, is a statistical measure that quantifies how much individual data points deviate from the average (mean). In financial markets, it reflects how dispersed prices are around their mean value over a certain period. A higher standard deviation indicates greater variability or risk within that timeframe.
Both metrics serve as vital indicators for assessing market conditions but approach volatility measurement from different angles—ATR focuses on price movement ranges considering gaps; standard deviation emphasizes overall dispersion based on historical data.
Practical Uses of ATR and Standard Deviation in Trading
Traders utilize these tools primarily for risk management, trend analysis, and developing trading strategies:
Market Volatility Assessment: High ATR or standard deviation signals increased uncertainty or rapid price swings—crucial information when deciding whether to enter or exit positions.
Stop-Loss Placement: Many traders use ATR-based stop-loss levels because they adapt dynamically with changing market conditions; wider stops during volatile periods prevent premature exits.
Range Estimation: Standard deviation helps estimate expected price ranges based on historical data—useful for setting profit targets aligned with typical fluctuations.
Trend Confirmation & Reversal Detection: A rising ATR often indicates strengthening trends or impending breakouts; conversely, decreasing values may suggest consolidation phases.
Incorporating both metrics allows traders to develop nuanced views of market behavior rather than relying solely on one indicator type.
Using Volatility Ratios: Combining ATR with Standard Deviation
The core idea behind using ratios between ATR and standard deviation lies in gaining deeper insights into relative versus absolute volatility levels:
Relative Volatility Measurement: Comparing these two metrics can reveal whether recent price movements are unusually large relative to historical norms.
Identifying Market Conditions:
- When ATR exceeds standard deviation, it might indicate heightened short-term activity not fully captured by historical dispersion—potentially signaling upcoming breakouts.
- Conversely, if standard deviation remains high while ATR stays low, this could suggest stable but wide-ranging prices—a sign of sideways markets rather than trending moves.
Volatility Ratio Calculation: Traders often compute ratios like
ATR / Standard Deviationover specific periods (e.g., daily) to monitor shifts:- An increasing ratio suggests growing short-term volatility compared to past variability.
- A decreasing ratio indicates stabilization after turbulent phases.
These ratios serve as early warning signals for adjusting trade sizes or tightening stop-losses accordingly.
Applying Volatility Ratios in Trading Strategies
Integrating these ratios into your trading toolkit can enhance strategy robustness:
Trend Following Adjustments:
- During strong trending periods indicated by rising ATR relative to standard deviation, traders might increase position sizes cautiously because momentum could persist longer.
Mean Reversion Opportunities:
- When the ratio spikes unexpectedly beyond typical levels—and combined with other technical signals—it may signal an overextended move ripe for reversal correction.
Volatility Breakout Triggers:
- Sharp increases in the ratio can precede breakout events; traders may set alerts when thresholds are crossed to prepare entry points ahead of significant moves.
Risk Management Enhancements:
- Dynamic stop-loss placement becomes more precise when considering both absolute (ATR) and relative (ratio) measures—they help avoid false triggers during normal fluctuations while protecting against genuine trend shifts.
In volatile environments like cryptocurrencies where rapid swings dominate daily trading activity since Bitcoin's launch in 2009—and especially during recent years’ surges—the ability to interpret these ratios becomes even more critical for maintaining profitability without exposing oneself excessively to downside risks.
Limitations & Cautions When Using These Metrics
While combining ATR with standard deviations offers powerful insights into market behavior, there are important caveats:
Overreliance on any single indicator—even well-established ones—can lead traders astray if used without context; always incorporate fundamental analysis where relevant.
Market manipulation tactics prevalent especially within crypto markets can artificially inflate perceived volatility metrics leading you astray if not corroborated with other data sources such as volume analysis or news flow.
Regulatory developments impact overall sentiment significantly; sudden policy changes can cause abrupt shifts not immediately reflected through historical volatilities measured by these tools.
Therefore, integrating multiple indicators—including volume patterns, macroeconomic factors—and maintaining disciplined risk controls remain essential components of successful trading strategies involving volatility measurements.
By understanding how ATM/Standard Deviation ratios reflect underlying market dynamics—and applying them thoughtfully—you gain an edge in navigating complex environments characterized by unpredictable swings like those seen recently across global financial assets including cryptocurrencies. Properly leveraging this knowledge enables better timing decisions—from entering trades at optimal moments through managing risks effectively—all grounded firmly within sound analytical principles rooted in transparency and empirical evidence.
Disclaimer:Contains third-party content. Not financial advice.
See Terms and Conditions.
Does MT4 Support Mobile Order Execution?
MetaTrader 4 (MT4) remains one of the most popular trading platforms globally, especially among forex traders. Its reputation for reliability, extensive analytical tools, and user-friendly interface has made it a go-to choice for both beginners and experienced traders. As mobile trading continues to grow in popularity, many users wonder whether MT4 fully supports order execution on mobile devices. This article explores the capabilities of MT4’s mobile platform regarding order placement and execution, providing clarity for traders seeking seamless mobile trading experiences.
Understanding MT4’s Mobile Trading Capabilities
Since its initial release in 2005 by MetaQuotes Software Corp., MT4 has evolved significantly. While initially designed as a desktop platform, the developers recognized the importance of mobile access early on. Around 2010, they launched the first version of the MT4 mobile app for iOS and Android devices. Today, these apps are integral to many traders’ daily routines.
The primary goal of these mobile applications is to offer essential trading functionalities while maintaining ease of use on smaller screens. They provide real-time market data, charting tools with technical indicators, account management features, and crucially—order execution capabilities.
Does MT4 Mobile Support Order Execution?
Yes — one of the key features supported by both iOS and Android versions of MT4 is order execution. Traders can place new buy or sell orders directly from their smartphones or tablets without needing access to a desktop computer.
The process typically involves selecting an asset from available markets within the app interface—such as currency pairs or commodities—and then choosing between different order types like market orders (executed immediately at current prices), pending orders (to be executed when certain conditions are met), or stop-loss/take-profit levels attached to trades.
This flexibility ensures that traders can respond swiftly to market movements regardless of their location—a vital aspect given how fast forex markets can change.
Features Supporting Mobile Order Placement
While basic order placement is straightforward on MT4’s mobile app, several features enhance this experience:
- Real-Time Quotes: Access live bid/ask prices before executing trades.
- Charting Tools: Use technical analysis directly within charts before placing an order.
- Order Types: Support for instant market orders as well as pending orders such as limit and stop orders.
- Trade Management: Modify or close open positions quickly through intuitive interfaces.
- Security Measures: Transactions are secured via SSL encryption; two-factor authentication adds extra security layers during login and trade confirmation processes.
These features collectively ensure that users have comprehensive control over their trades even when using a smartphone or tablet.
Recent Improvements in Mobile Order Execution
MetaQuotes regularly updates its apps based on user feedback and technological advancements. Since around 2020–2022, notable improvements include enhanced stability across various device models and operating system versions—reducing connectivity issues that some users previously faced.
Additionally:
- The integration with other financial services platforms has improved account management options.
- User interfaces have become more streamlined for easier navigation during fast-paced trading sessions.
- Performance enhancements allow faster trade executions with minimal lag time—a critical factor during volatile market conditions.
Such updates reinforce that support for efficient mobile order execution remains a priority within MetaTrader 4's development roadmap.
Limitations & Considerations
Despite robust support for order placement via its mobile app, some limitations exist:
- Partial Feature Set Compared to Desktop Version: Certain advanced charting tools or custom indicators may not be fully available on mobiles.
- Connectivity Dependency: Reliable internet connection is essential; poor network quality can delay trade executions or cause disconnections.
- Device Compatibility: Older smartphones might experience performance issues due to hardware limitations despite software updates.
Traders should also ensure they use secure networks when executing trades remotely since sensitive financial data transmits over internet connections vulnerable to interception if not properly encrypted—which MetaTrader addresses through SSL encryption but still warrants caution from users handling significant capital amounts.
How Does MT4 Compare With Competitors?
In today’s competitive landscape featuring platforms like MetaTrader 5 (MT5), cTrader, NinjaTrader among others—MT4 holds its ground thanks largely due to its widespread adoption over years combined with reliable core functionalities like support for full-order execution on mobiles.
However,
- Some newer platforms offer more advanced charting tools,
- Better multi-account management,
- Enhanced automation capabilities,
which could influence trader preferences depending on individual needs.
Final Thoughts: Is MT4 Suitable For Mobile Trading?
For most retail forex traders seeking reliable mobility options—with full support for placing new trades including various order types—the answer is affirmative: MetaTrader 4 does indeed support comprehensive mobile order execution. Its dedicated apps provide essential functionalities needed in modern trading environments while maintaining security standards expected by serious investors.
While there are minor limitations compared with desktop versions—or more recent competitors—the overall experience remains solid enough that many traders rely heavily on their smartphones during active markets days.
Key Takeaways:
MT4's official apps enable seamless buy/sell operations across iOS & Android devices.
Regular updates improve stability & feature set.
Connectivity issues remain potential hurdles but generally manageable.
By understanding these aspects thoroughly—and ensuring proper device security—you can confidently incorporate your smartphone into your daily trading routine using MetaTrader 4 effectively.
If you're considering switching platforms or want additional insights into optimizing your mobile trading setup with MT4—or any other platform—staying informed about recent developments will help you make smarter decisions aligned with current technology trends in online Forex trading environments
JCUSER-IC8sJL1q
2025-05-26 14:58
Does MT4 support mobile order execution?
Does MT4 Support Mobile Order Execution?
MetaTrader 4 (MT4) remains one of the most popular trading platforms globally, especially among forex traders. Its reputation for reliability, extensive analytical tools, and user-friendly interface has made it a go-to choice for both beginners and experienced traders. As mobile trading continues to grow in popularity, many users wonder whether MT4 fully supports order execution on mobile devices. This article explores the capabilities of MT4’s mobile platform regarding order placement and execution, providing clarity for traders seeking seamless mobile trading experiences.
Understanding MT4’s Mobile Trading Capabilities
Since its initial release in 2005 by MetaQuotes Software Corp., MT4 has evolved significantly. While initially designed as a desktop platform, the developers recognized the importance of mobile access early on. Around 2010, they launched the first version of the MT4 mobile app for iOS and Android devices. Today, these apps are integral to many traders’ daily routines.
The primary goal of these mobile applications is to offer essential trading functionalities while maintaining ease of use on smaller screens. They provide real-time market data, charting tools with technical indicators, account management features, and crucially—order execution capabilities.
Does MT4 Mobile Support Order Execution?
Yes — one of the key features supported by both iOS and Android versions of MT4 is order execution. Traders can place new buy or sell orders directly from their smartphones or tablets without needing access to a desktop computer.
The process typically involves selecting an asset from available markets within the app interface—such as currency pairs or commodities—and then choosing between different order types like market orders (executed immediately at current prices), pending orders (to be executed when certain conditions are met), or stop-loss/take-profit levels attached to trades.
This flexibility ensures that traders can respond swiftly to market movements regardless of their location—a vital aspect given how fast forex markets can change.
Features Supporting Mobile Order Placement
While basic order placement is straightforward on MT4’s mobile app, several features enhance this experience:
- Real-Time Quotes: Access live bid/ask prices before executing trades.
- Charting Tools: Use technical analysis directly within charts before placing an order.
- Order Types: Support for instant market orders as well as pending orders such as limit and stop orders.
- Trade Management: Modify or close open positions quickly through intuitive interfaces.
- Security Measures: Transactions are secured via SSL encryption; two-factor authentication adds extra security layers during login and trade confirmation processes.
These features collectively ensure that users have comprehensive control over their trades even when using a smartphone or tablet.
Recent Improvements in Mobile Order Execution
MetaQuotes regularly updates its apps based on user feedback and technological advancements. Since around 2020–2022, notable improvements include enhanced stability across various device models and operating system versions—reducing connectivity issues that some users previously faced.
Additionally:
- The integration with other financial services platforms has improved account management options.
- User interfaces have become more streamlined for easier navigation during fast-paced trading sessions.
- Performance enhancements allow faster trade executions with minimal lag time—a critical factor during volatile market conditions.
Such updates reinforce that support for efficient mobile order execution remains a priority within MetaTrader 4's development roadmap.
Limitations & Considerations
Despite robust support for order placement via its mobile app, some limitations exist:
- Partial Feature Set Compared to Desktop Version: Certain advanced charting tools or custom indicators may not be fully available on mobiles.
- Connectivity Dependency: Reliable internet connection is essential; poor network quality can delay trade executions or cause disconnections.
- Device Compatibility: Older smartphones might experience performance issues due to hardware limitations despite software updates.
Traders should also ensure they use secure networks when executing trades remotely since sensitive financial data transmits over internet connections vulnerable to interception if not properly encrypted—which MetaTrader addresses through SSL encryption but still warrants caution from users handling significant capital amounts.
How Does MT4 Compare With Competitors?
In today’s competitive landscape featuring platforms like MetaTrader 5 (MT5), cTrader, NinjaTrader among others—MT4 holds its ground thanks largely due to its widespread adoption over years combined with reliable core functionalities like support for full-order execution on mobiles.
However,
- Some newer platforms offer more advanced charting tools,
- Better multi-account management,
- Enhanced automation capabilities,
which could influence trader preferences depending on individual needs.
Final Thoughts: Is MT4 Suitable For Mobile Trading?
For most retail forex traders seeking reliable mobility options—with full support for placing new trades including various order types—the answer is affirmative: MetaTrader 4 does indeed support comprehensive mobile order execution. Its dedicated apps provide essential functionalities needed in modern trading environments while maintaining security standards expected by serious investors.
While there are minor limitations compared with desktop versions—or more recent competitors—the overall experience remains solid enough that many traders rely heavily on their smartphones during active markets days.
Key Takeaways:
MT4's official apps enable seamless buy/sell operations across iOS & Android devices.
Regular updates improve stability & feature set.
Connectivity issues remain potential hurdles but generally manageable.
By understanding these aspects thoroughly—and ensuring proper device security—you can confidently incorporate your smartphone into your daily trading routine using MetaTrader 4 effectively.
If you're considering switching platforms or want additional insights into optimizing your mobile trading setup with MT4—or any other platform—staying informed about recent developments will help you make smarter decisions aligned with current technology trends in online Forex trading environments
Disclaimer:Contains third-party content. Not financial advice.
See Terms and Conditions.
Limit Order vs. Market Order: A Complete Guide for Investors and Traders
Understanding how to effectively execute trades is fundamental for anyone involved in investing or trading. Two primary types of orders—limit orders and market orders—serve different purposes and come with distinct advantages and risks. Knowing when and how to use each can significantly impact your investment outcomes, especially in volatile markets like stocks or cryptocurrencies.
What Is a Limit Order?
A limit order is an instruction to buy or sell a security at a specific price or better. When placing a limit buy order, you set the maximum price you're willing to pay; for a limit sell, you specify the minimum price you're willing to accept. This type of order remains open until it is either executed at your specified price or canceled by you.
Limit orders are particularly useful when investors want control over their entry or exit points, especially during periods of high volatility where prices can fluctuate rapidly. For example, if Bitcoin is trading at $40,000 but you believe it will drop further before rising again, placing a limit buy order at $38,000 allows you to potentially purchase the asset at that lower price without constantly monitoring the market.
How Does a Market Order Work?
In contrast, a market order instructs your broker to execute the trade immediately at the best available current market price. This type of order prioritizes speed over price precision; as soon as your broker receives it, they will fill it based on current liquidity and prevailing prices.
Market orders are favored by traders who need quick execution—such as day traders—or investors who want certainty that their trade will be completed promptly regardless of minor fluctuations in price. For instance, if an investor wants to quickly capitalize on news-driven momentum in stock prices during high-volume trading hours, executing with a market order ensures immediate action but may result in paying slightly more than expected due to rapid changes.
Key Differences Between Limit Orders and Market Orders
While both serve essential roles within trading strategies, understanding their core differences helps investors choose appropriately:
Execution Speed:
- Limit Orders: May take time or may not execute if conditions aren’t met.
- Market Orders: Executed instantly once received.
Price Control:
- Limit Orders: Allow precise control over buying/selling prices.
- Market Orders: No control; executed at current market prices which can vary rapidly.
Risk Exposure:
- Limit Orders: Reduce risk of unfavorable trades but might not get filled.
- Market Orders: Ensure quick execution but risk paying more (or receiving less) than anticipated due to slippage.
Ideal Use Cases:
- Limit Orders: Suitable for long-term investors aiming for specific entry/exit points without reacting immediately.
- Market Orders: Better suited for short-term traders seeking swift execution amid fast-moving markets.
Recent Trends Impacting Order Types
The evolution of financial markets has seen increased reliance on these order types across various asset classes:
- In cryptocurrency markets—which are known for extreme volatility—limit orders help traders avoid sudden swings by setting predefined purchase or sale levels during surges like Bitcoin’s rapid rise in late 2021.
- During periods such as the COVID-19 pandemic’s stock market turbulence in 2020–2021, many investors turned toward limit orders as protective measures against unpredictable swings while maintaining strategic pricing targets.
- Regulatory bodies like the U.S. Securities and Exchange Commission (SEC) have been examining rules around transparency related to how these orders are executed — aiming both to protect retail investors from potential manipulation and ensure fairer access across platforms.
Risks Associated With Each Type
Despite their benefits, both types carry inherent risks that users should understand:
Risks with Limit Orders:
- If the target price isn’t reached within your specified timeframe—or ever—the trade remains unexecuted
- Large accumulation of unfilled limit orders can create artificial demand signals that influence other traders’ perceptions
Risks with Market Orders:
- Slippage occurs when rapid movements cause executions above (or below) expected prices
- During low liquidity periods (e.g., after-hours trading), executing large market orders might significantly impact asset prices adversely
Furthermore, improper use can lead traders into pitfalls such as "order imbalances," where too many pending limit bids distort normal supply-demand dynamics — potentially leading to delayed executions or unexpected costs.
Practical Tips for Choosing Between Limit and Market Orders
To optimize your trading strategy:
Use limit orders when:
- You’re targeting specific entry/exit points
- You wish to avoid paying above certain thresholds
- Trading assets with lower liquidity where immediate execution isn’t critical
Opt for market orders when:
- Speed matters more than exact pricing
- You need quick liquidation during volatile events
- The asset has high liquidity ensuring minimal slippage
Consider combining strategies—for example:
Place limit buy/sell limits near key support/resistance levels while using market stops around critical thresholds—to balance control with responsiveness.Always monitor open positions regularly because conditions change rapidly; what was advantageous yesterday might not hold today amid shifting markets.
By grasping these distinctions—and staying informed about recent developments—you empower yourself with better tools for navigating complex financial landscapes safely and efficiently.
References
- Applied Materials shares drop after weak China sales report (2025)
- Cryptocurrency Trading Strategies (2021)
- Stock Market Volatility & Trading Tactics (2020)
- SEC Regulatory Updates on Trading Practices (2023)
- Techniques Used in Market Manipulation & Their Impact (2022)
- Understanding Order Imbalance Effects on Markets (2022)
This comprehensive overview aims not only at clarifying technical differences but also providing practical insights aligned with user intent—helping both novice investors learn foundational concepts while offering seasoned traders nuanced considerations based on recent trends.*
JCUSER-WVMdslBw
2025-05-22 05:20
What is the difference between placing a "limit order" and a "market order"?
Limit Order vs. Market Order: A Complete Guide for Investors and Traders
Understanding how to effectively execute trades is fundamental for anyone involved in investing or trading. Two primary types of orders—limit orders and market orders—serve different purposes and come with distinct advantages and risks. Knowing when and how to use each can significantly impact your investment outcomes, especially in volatile markets like stocks or cryptocurrencies.
What Is a Limit Order?
A limit order is an instruction to buy or sell a security at a specific price or better. When placing a limit buy order, you set the maximum price you're willing to pay; for a limit sell, you specify the minimum price you're willing to accept. This type of order remains open until it is either executed at your specified price or canceled by you.
Limit orders are particularly useful when investors want control over their entry or exit points, especially during periods of high volatility where prices can fluctuate rapidly. For example, if Bitcoin is trading at $40,000 but you believe it will drop further before rising again, placing a limit buy order at $38,000 allows you to potentially purchase the asset at that lower price without constantly monitoring the market.
How Does a Market Order Work?
In contrast, a market order instructs your broker to execute the trade immediately at the best available current market price. This type of order prioritizes speed over price precision; as soon as your broker receives it, they will fill it based on current liquidity and prevailing prices.
Market orders are favored by traders who need quick execution—such as day traders—or investors who want certainty that their trade will be completed promptly regardless of minor fluctuations in price. For instance, if an investor wants to quickly capitalize on news-driven momentum in stock prices during high-volume trading hours, executing with a market order ensures immediate action but may result in paying slightly more than expected due to rapid changes.
Key Differences Between Limit Orders and Market Orders
While both serve essential roles within trading strategies, understanding their core differences helps investors choose appropriately:
Execution Speed:
- Limit Orders: May take time or may not execute if conditions aren’t met.
- Market Orders: Executed instantly once received.
Price Control:
- Limit Orders: Allow precise control over buying/selling prices.
- Market Orders: No control; executed at current market prices which can vary rapidly.
Risk Exposure:
- Limit Orders: Reduce risk of unfavorable trades but might not get filled.
- Market Orders: Ensure quick execution but risk paying more (or receiving less) than anticipated due to slippage.
Ideal Use Cases:
- Limit Orders: Suitable for long-term investors aiming for specific entry/exit points without reacting immediately.
- Market Orders: Better suited for short-term traders seeking swift execution amid fast-moving markets.
Recent Trends Impacting Order Types
The evolution of financial markets has seen increased reliance on these order types across various asset classes:
- In cryptocurrency markets—which are known for extreme volatility—limit orders help traders avoid sudden swings by setting predefined purchase or sale levels during surges like Bitcoin’s rapid rise in late 2021.
- During periods such as the COVID-19 pandemic’s stock market turbulence in 2020–2021, many investors turned toward limit orders as protective measures against unpredictable swings while maintaining strategic pricing targets.
- Regulatory bodies like the U.S. Securities and Exchange Commission (SEC) have been examining rules around transparency related to how these orders are executed — aiming both to protect retail investors from potential manipulation and ensure fairer access across platforms.
Risks Associated With Each Type
Despite their benefits, both types carry inherent risks that users should understand:
Risks with Limit Orders:
- If the target price isn’t reached within your specified timeframe—or ever—the trade remains unexecuted
- Large accumulation of unfilled limit orders can create artificial demand signals that influence other traders’ perceptions
Risks with Market Orders:
- Slippage occurs when rapid movements cause executions above (or below) expected prices
- During low liquidity periods (e.g., after-hours trading), executing large market orders might significantly impact asset prices adversely
Furthermore, improper use can lead traders into pitfalls such as "order imbalances," where too many pending limit bids distort normal supply-demand dynamics — potentially leading to delayed executions or unexpected costs.
Practical Tips for Choosing Between Limit and Market Orders
To optimize your trading strategy:
Use limit orders when:
- You’re targeting specific entry/exit points
- You wish to avoid paying above certain thresholds
- Trading assets with lower liquidity where immediate execution isn’t critical
Opt for market orders when:
- Speed matters more than exact pricing
- You need quick liquidation during volatile events
- The asset has high liquidity ensuring minimal slippage
Consider combining strategies—for example:
Place limit buy/sell limits near key support/resistance levels while using market stops around critical thresholds—to balance control with responsiveness.Always monitor open positions regularly because conditions change rapidly; what was advantageous yesterday might not hold today amid shifting markets.
By grasping these distinctions—and staying informed about recent developments—you empower yourself with better tools for navigating complex financial landscapes safely and efficiently.
References
- Applied Materials shares drop after weak China sales report (2025)
- Cryptocurrency Trading Strategies (2021)
- Stock Market Volatility & Trading Tactics (2020)
- SEC Regulatory Updates on Trading Practices (2023)
- Techniques Used in Market Manipulation & Their Impact (2022)
- Understanding Order Imbalance Effects on Markets (2022)
This comprehensive overview aims not only at clarifying technical differences but also providing practical insights aligned with user intent—helping both novice investors learn foundational concepts while offering seasoned traders nuanced considerations based on recent trends.*
Disclaimer:Contains third-party content. Not financial advice.
See Terms and Conditions.
What Is a Cross-Chain Atomic Swap and How Does It Work?
Cross-chain atomic swaps are revolutionizing the way cryptocurrencies are exchanged across different blockchain networks. They enable users to trade assets directly without relying on centralized exchanges, fostering a more decentralized and secure trading environment. This technology is especially significant in the context of blockchain interoperability, where diverse networks need to communicate seamlessly.
Understanding Cross-Chain Atomic Swaps
At its core, a cross-chain atomic swap is a peer-to-peer transaction that allows two parties to exchange different cryptocurrencies across separate blockchains securely and trustlessly. The term "atomic" signifies that the transaction is indivisible—either both sides complete their part of the trade or neither does. This all-or-nothing approach eliminates counterparty risk, which has historically been a concern in cross-exchange trades.
For example, imagine Alice wants to swap her Bitcoin for Bob’s Litecoin. Instead of going through an intermediary or centralized exchange, they can perform an atomic swap directly between their wallets on Bitcoin and Litecoin blockchains. If either party fails to fulfill their side of the deal, the entire transaction cancels automatically, ensuring fairness and security.
How Are Cross-Chain Atomic Swaps Implemented?
Implementing these swaps involves several sophisticated components designed to ensure security and trustlessness:
Smart Contracts
Smart contracts are self-executing contracts with predefined rules stored on blockchain networks. In atomic swaps, smart contracts facilitate escrow-like conditions that enforce the terms of exchange without third-party oversight.
Hash Time-Locked Contracts (HTLCs)
HTLCs are fundamental in enabling atomicity across chains. They work by locking assets with cryptographic hashes combined with time constraints:
- Hash Lock: The sender generates a secret hash; funds are locked until this hash is revealed.
- Time Lock: Ensures funds can be reclaimed if conditions aren’t met within specified timeframes.
This mechanism guarantees that either both parties reveal their secrets simultaneously—completing the swap—or funds revert back after timeout periods if something goes wrong.
Multi-Signature Wallets
Multi-signature wallets require multiple private keys for transactions approval. These add an extra layer of security during asset management before and after swaps by preventing unauthorized access or unilateral actions during critical phases.
Off-Chain Negotiation
Prior to executing an atomic swap, participants typically negotiate off-chain using encrypted messaging channels or other communication methods. They agree upon terms such as amount, asset type, and timing before initiating on-chain transactions via smart contracts.
Why Are Cross-Chain Atomic Swaps Important?
The significance lies in how they enhance decentralization and interoperability within blockchain ecosystems:
Decentralized Exchanges (DEXs): Atomic swaps empower DEX platforms by allowing users to trade assets from different chains directly without intermediaries.
Increased Liquidity & Market Efficiency: By removing reliance on centralized exchanges—which often have liquidity constraints—atomic swaps facilitate broader market participation.
Enhanced Security & Privacy: Since transactions occur directly between users’ wallets under smart contract control rather than through third-party platforms, privacy improves while reducing hacking risks associated with custodial exchanges.
This technology aligns well with broader trends toward decentralization in crypto markets while supporting innovative trading strategies involving multiple tokens across various blockchains.
Recent Innovations Driving Adoption
Recent years have seen notable advancements aimed at improving scalability and usability:
Lightning Network Integration: Some implementations incorporate Lightning Network protocols for faster settlement times and lower fees—especially relevant for Bitcoin-based swaps.
Layer 2 Solutions & Sidechains: Projects leverage sidechains like RSK or Layer 2 solutions such as state channels to reduce congestion issues inherent in mainnet operations.
Interoperability Platforms: Ecosystems like Polkadot’s parachains or Cosmos’ IBC protocol actively develop cross-chain swapping capabilities into their infrastructure frameworks—making integration more seamless for developers.
Moreover, ongoing efforts aim at regulatory clarity around decentralized trading mechanisms which could accelerate adoption globally while addressing compliance concerns related to anti-money laundering (AML) laws or Know Your Customer (KYC) requirements.
Challenges Facing Cross-Chain Atomic Swaps
Despite promising prospects, several hurdles remain:
Security Concerns
Smart contract vulnerabilities pose significant risks; exploits like reentrancy attacks could lead to loss of funds if not properly mitigated through rigorous audits and testing processes.
Scalability Limitations
As usage grows exponentially—with increased transaction volume—the underlying blockchain networks may face congestion issues impacting speed and cost-efficiency during high-demand periods.
Regulatory Uncertainty
The evolving legal landscape surrounding decentralized finance (DeFi) tools introduces ambiguity about compliance standards worldwide—a factor that might slow down widespread deployment unless clear guidelines emerge from regulators globally.
Key Milestones in Cross-Chain Swap Development
Understanding historical milestones helps contextualize current capabilities:
- The concept was first proposed by Adam Back back in 2013—a visionary idea aiming at enabling trustless asset transfers across chains.
- The first practical implementation occurred around 2017 when developers demonstrated cross-chain swapping between Bitcoin and Litecoin using HTLC-based protocols.
- Since then, projects like Polkadot launched active development efforts around 2020 focused on integrating cross-chain swapping into multi-paradigm ecosystems.
- Similarly, Cosmos has been exploring inter-blockchain communication protocols capable of supporting seamless token transfers among connected zones—including popular chains like Binance Smart Chain (BSC) or Terra LUNA.
Final Thoughts
Cross-chain atomic swaps stand out as pivotal innovations shaping future decentralized finance landscapes by promoting interoperability without sacrificing security or user control over assets themselves.. As technological improvements continue alongside growing community engagement—and regulatory clarity emerges—the potential for widespread adoption increases significantly.. For developers interested in DeFi innovation—or traders seeking more flexible ways to manage diverse crypto portfolios—understanding how these protocols work offers valuable insights into next-generation financial tools built atop blockchain technology's foundational principles..
JCUSER-WVMdslBw
2025-05-14 10:47
What is cross-chain atomic swap and how is it implemented?
What Is a Cross-Chain Atomic Swap and How Does It Work?
Cross-chain atomic swaps are revolutionizing the way cryptocurrencies are exchanged across different blockchain networks. They enable users to trade assets directly without relying on centralized exchanges, fostering a more decentralized and secure trading environment. This technology is especially significant in the context of blockchain interoperability, where diverse networks need to communicate seamlessly.
Understanding Cross-Chain Atomic Swaps
At its core, a cross-chain atomic swap is a peer-to-peer transaction that allows two parties to exchange different cryptocurrencies across separate blockchains securely and trustlessly. The term "atomic" signifies that the transaction is indivisible—either both sides complete their part of the trade or neither does. This all-or-nothing approach eliminates counterparty risk, which has historically been a concern in cross-exchange trades.
For example, imagine Alice wants to swap her Bitcoin for Bob’s Litecoin. Instead of going through an intermediary or centralized exchange, they can perform an atomic swap directly between their wallets on Bitcoin and Litecoin blockchains. If either party fails to fulfill their side of the deal, the entire transaction cancels automatically, ensuring fairness and security.
How Are Cross-Chain Atomic Swaps Implemented?
Implementing these swaps involves several sophisticated components designed to ensure security and trustlessness:
Smart Contracts
Smart contracts are self-executing contracts with predefined rules stored on blockchain networks. In atomic swaps, smart contracts facilitate escrow-like conditions that enforce the terms of exchange without third-party oversight.
Hash Time-Locked Contracts (HTLCs)
HTLCs are fundamental in enabling atomicity across chains. They work by locking assets with cryptographic hashes combined with time constraints:
- Hash Lock: The sender generates a secret hash; funds are locked until this hash is revealed.
- Time Lock: Ensures funds can be reclaimed if conditions aren’t met within specified timeframes.
This mechanism guarantees that either both parties reveal their secrets simultaneously—completing the swap—or funds revert back after timeout periods if something goes wrong.
Multi-Signature Wallets
Multi-signature wallets require multiple private keys for transactions approval. These add an extra layer of security during asset management before and after swaps by preventing unauthorized access or unilateral actions during critical phases.
Off-Chain Negotiation
Prior to executing an atomic swap, participants typically negotiate off-chain using encrypted messaging channels or other communication methods. They agree upon terms such as amount, asset type, and timing before initiating on-chain transactions via smart contracts.
Why Are Cross-Chain Atomic Swaps Important?
The significance lies in how they enhance decentralization and interoperability within blockchain ecosystems:
Decentralized Exchanges (DEXs): Atomic swaps empower DEX platforms by allowing users to trade assets from different chains directly without intermediaries.
Increased Liquidity & Market Efficiency: By removing reliance on centralized exchanges—which often have liquidity constraints—atomic swaps facilitate broader market participation.
Enhanced Security & Privacy: Since transactions occur directly between users’ wallets under smart contract control rather than through third-party platforms, privacy improves while reducing hacking risks associated with custodial exchanges.
This technology aligns well with broader trends toward decentralization in crypto markets while supporting innovative trading strategies involving multiple tokens across various blockchains.
Recent Innovations Driving Adoption
Recent years have seen notable advancements aimed at improving scalability and usability:
Lightning Network Integration: Some implementations incorporate Lightning Network protocols for faster settlement times and lower fees—especially relevant for Bitcoin-based swaps.
Layer 2 Solutions & Sidechains: Projects leverage sidechains like RSK or Layer 2 solutions such as state channels to reduce congestion issues inherent in mainnet operations.
Interoperability Platforms: Ecosystems like Polkadot’s parachains or Cosmos’ IBC protocol actively develop cross-chain swapping capabilities into their infrastructure frameworks—making integration more seamless for developers.
Moreover, ongoing efforts aim at regulatory clarity around decentralized trading mechanisms which could accelerate adoption globally while addressing compliance concerns related to anti-money laundering (AML) laws or Know Your Customer (KYC) requirements.
Challenges Facing Cross-Chain Atomic Swaps
Despite promising prospects, several hurdles remain:
Security Concerns
Smart contract vulnerabilities pose significant risks; exploits like reentrancy attacks could lead to loss of funds if not properly mitigated through rigorous audits and testing processes.
Scalability Limitations
As usage grows exponentially—with increased transaction volume—the underlying blockchain networks may face congestion issues impacting speed and cost-efficiency during high-demand periods.
Regulatory Uncertainty
The evolving legal landscape surrounding decentralized finance (DeFi) tools introduces ambiguity about compliance standards worldwide—a factor that might slow down widespread deployment unless clear guidelines emerge from regulators globally.
Key Milestones in Cross-Chain Swap Development
Understanding historical milestones helps contextualize current capabilities:
- The concept was first proposed by Adam Back back in 2013—a visionary idea aiming at enabling trustless asset transfers across chains.
- The first practical implementation occurred around 2017 when developers demonstrated cross-chain swapping between Bitcoin and Litecoin using HTLC-based protocols.
- Since then, projects like Polkadot launched active development efforts around 2020 focused on integrating cross-chain swapping into multi-paradigm ecosystems.
- Similarly, Cosmos has been exploring inter-blockchain communication protocols capable of supporting seamless token transfers among connected zones—including popular chains like Binance Smart Chain (BSC) or Terra LUNA.
Final Thoughts
Cross-chain atomic swaps stand out as pivotal innovations shaping future decentralized finance landscapes by promoting interoperability without sacrificing security or user control over assets themselves.. As technological improvements continue alongside growing community engagement—and regulatory clarity emerges—the potential for widespread adoption increases significantly.. For developers interested in DeFi innovation—or traders seeking more flexible ways to manage diverse crypto portfolios—understanding how these protocols work offers valuable insights into next-generation financial tools built atop blockchain technology's foundational principles..
Disclaimer:Contains third-party content. Not financial advice.
See Terms and Conditions.
Historical Price Cycles of Bitcoin: A Complete Overview
Understanding the historical price cycles of Bitcoin is essential for investors, enthusiasts, and market analysts alike. Since its inception in 2009, Bitcoin has experienced dramatic fluctuations that reflect broader trends in the cryptocurrency ecosystem. These cycles are shaped by a combination of technological developments, regulatory shifts, investor sentiment, and macroeconomic factors. This article provides a comprehensive look at Bitcoin’s past price movements to help contextualize its current position and future potential.
The Early Years (2009-2013): The Birth and Initial Growth
Bitcoin was created in 2009 by Satoshi Nakamoto—a pseudonym for an individual or group whose identity remains unknown. During this initial phase, Bitcoin's value was negligible; it traded at around $0.0008 per coin with virtually no mainstream attention. The first notable price increase occurred in 2011 when Bitcoin reached approximately $31.91 in June—its first significant bull run driven largely by media coverage and early adopter speculation.
However, this early enthusiasm was short-lived as the market faced its first major setback later that year due to security issues with Mt. Gox—the largest exchange at the time—and increasing regulatory scrutiny worldwide. By 2013, prices had fallen back to around $150 amid concerns over exchange security breaches and regulatory crackdowns on cryptocurrency trading platforms.
The Rise of Institutional Interest (2017-2018): Mainstream Adoption Sparks Surge
The period from late 2017 through early 2018 marked one of the most explosive phases in Bitcoin’s history. In December 2017, prices soared close to $20,000—an all-time high fueled by rising institutional interest alongside retail investor enthusiasm sparked by initial coin offerings (ICOs). During this period, numerous new exchanges entered the scene while mainstream financial institutions began exploring blockchain technology.
Regulatory clarity also played a role; notably when U.S regulators issued guidance on ICOs which helped legitimize certain aspects of crypto investments for traditional investors. Despite these gains, volatility remained high—by mid-2018, prices had plummeted back down to roughly $3,000 due to regulatory uncertainties across various jurisdictions combined with speculative excesses leading up to that peak.
Bear Market and Recovery Phase (2018-2020): Market Correction & Halving Events
Following the dramatic peak of late 2017/early 2018 came a prolonged bear market characterized by sharp declines and heightened volatility—a common feature within crypto markets historically driven by profit-taking behaviors among traders seeking quick gains.
In May 2020 however came a pivotal event: the third “halving,” which reduced miners’ block rewards from 12.5 BTC to just 6.25 BTC per block mined—a process embedded into Bitcoin’s protocol designed to control supply inflation over time. Historically speaking, halving events have often preceded substantial price increases as scarcity intensifies supply constraints.
The COVID-19 pandemic further accelerated interest as many investors viewed cryptocurrencies like Bitcoin as safe-haven assets amidst economic uncertainty; consequently during late-2020 into early-2021 bitcoin surged past previous highs reaching approximately $64K in April—marking another major milestone reflecting renewed confidence from institutional players such as hedge funds and corporations adopting digital assets.
Recent Trends (2021–Present): Record Highs & Market Volatility
In April 2021 alone saw an all-time high near $65K driven primarily by increased institutional adoption—including Tesla’s announcement accepting bitcoin payments—and growing acceptance among retail investors via platforms like PayPal or Square Cash App.
However recent years have also demonstrated how volatile these markets remain; despite record inflows into ETFs—which recorded nearly $2.78 billion within just seven days in April 2025—the market experienced its worst quarterly performance since a decade earlier during Q1 of that year with an approximate decline of over11%. Such swings highlight ongoing risks associated with macroeconomic factors such as inflation fears or geopolitical tensions influencing investor behavior globally.
Key Milestones Recap:
- 2009: Creation of Bitcoin
- June 2011: First bull run reaching ~$31
- End of First Bear Market (~mid-2013): Price drops below ~$150
- December 2017: Peak near ~$20K
- December 2018: Bear low around ~$3K
- May 2020: Third halving event reduces supply rate
- April/May 2021: All-time highs approaching ~$65K
- April 2025: Surge nearing ~$95K amid ETF inflows but followed by downturns
Factors Influencing Historical Price Cycles
Bitcoin's cyclical nature is heavily influenced not only by internal network events like halvings but also external factors including:
- Regulatory developments – Governments worldwide continue debating how best to regulate cryptocurrencies.
- Technological progress – Innovations such as Lightning Network improve scalability.
- Investor sentiment – FOMO (Fear Of Missing Out) often drives rapid surges.
- Macroeconomic conditions – Inflation rates or economic crises tend to push demand toward decentralized assets like bitcoin.
Understanding these elements helps explain why periods of rapid growth are often followed by corrections before another upward cycle begins.
Potential Risks & Future Outlook
While recent trends suggest growing institutional confidence reflected through ETF inflows and mainstream acceptance signals positive momentum for bitcoin’s long-term viability—as well as increased liquidity—the inherent volatility remains significant risk factor for investors relying on historical patterns alone.
Market participants should consider scenarios where:
- Regulatory crackdowns could tighten restrictions or ban certain activities,
- Technological setbacks might hinder scalability,
- External shocks could trigger sudden sell-offs similar to past corrections,
- Continued innovation may lead toward more stable valuation models over time,
Monitoring these dynamics is crucial for anyone involved or interested in cryptocurrency markets today.
Final Thoughts on Historical Price Cycles
Bitcoin's journey from fringe digital experiment towards becoming a global asset class exemplifies complex cyclical patterns influenced both internally through protocol adjustments like halvings—and externally via macroeconomic forces and regulation changes. Recognizing these cycles can aid investors’ decision-making processes while emphasizing caution given ongoing volatility risks despite promising growth indicators seen recently through ETF inflows and institutional participation.
By understanding past trends deeply rooted within each cycle phase—from initial emergence through boom-and-bust periods—stakeholders can better navigate future developments within this dynamic landscape shaped continually by technological innovation alongside evolving regulations worldwide.
Lo
2025-05-14 09:05
What historical price cycles has Bitcoin experienced?
Historical Price Cycles of Bitcoin: A Complete Overview
Understanding the historical price cycles of Bitcoin is essential for investors, enthusiasts, and market analysts alike. Since its inception in 2009, Bitcoin has experienced dramatic fluctuations that reflect broader trends in the cryptocurrency ecosystem. These cycles are shaped by a combination of technological developments, regulatory shifts, investor sentiment, and macroeconomic factors. This article provides a comprehensive look at Bitcoin’s past price movements to help contextualize its current position and future potential.
The Early Years (2009-2013): The Birth and Initial Growth
Bitcoin was created in 2009 by Satoshi Nakamoto—a pseudonym for an individual or group whose identity remains unknown. During this initial phase, Bitcoin's value was negligible; it traded at around $0.0008 per coin with virtually no mainstream attention. The first notable price increase occurred in 2011 when Bitcoin reached approximately $31.91 in June—its first significant bull run driven largely by media coverage and early adopter speculation.
However, this early enthusiasm was short-lived as the market faced its first major setback later that year due to security issues with Mt. Gox—the largest exchange at the time—and increasing regulatory scrutiny worldwide. By 2013, prices had fallen back to around $150 amid concerns over exchange security breaches and regulatory crackdowns on cryptocurrency trading platforms.
The Rise of Institutional Interest (2017-2018): Mainstream Adoption Sparks Surge
The period from late 2017 through early 2018 marked one of the most explosive phases in Bitcoin’s history. In December 2017, prices soared close to $20,000—an all-time high fueled by rising institutional interest alongside retail investor enthusiasm sparked by initial coin offerings (ICOs). During this period, numerous new exchanges entered the scene while mainstream financial institutions began exploring blockchain technology.
Regulatory clarity also played a role; notably when U.S regulators issued guidance on ICOs which helped legitimize certain aspects of crypto investments for traditional investors. Despite these gains, volatility remained high—by mid-2018, prices had plummeted back down to roughly $3,000 due to regulatory uncertainties across various jurisdictions combined with speculative excesses leading up to that peak.
Bear Market and Recovery Phase (2018-2020): Market Correction & Halving Events
Following the dramatic peak of late 2017/early 2018 came a prolonged bear market characterized by sharp declines and heightened volatility—a common feature within crypto markets historically driven by profit-taking behaviors among traders seeking quick gains.
In May 2020 however came a pivotal event: the third “halving,” which reduced miners’ block rewards from 12.5 BTC to just 6.25 BTC per block mined—a process embedded into Bitcoin’s protocol designed to control supply inflation over time. Historically speaking, halving events have often preceded substantial price increases as scarcity intensifies supply constraints.
The COVID-19 pandemic further accelerated interest as many investors viewed cryptocurrencies like Bitcoin as safe-haven assets amidst economic uncertainty; consequently during late-2020 into early-2021 bitcoin surged past previous highs reaching approximately $64K in April—marking another major milestone reflecting renewed confidence from institutional players such as hedge funds and corporations adopting digital assets.
Recent Trends (2021–Present): Record Highs & Market Volatility
In April 2021 alone saw an all-time high near $65K driven primarily by increased institutional adoption—including Tesla’s announcement accepting bitcoin payments—and growing acceptance among retail investors via platforms like PayPal or Square Cash App.
However recent years have also demonstrated how volatile these markets remain; despite record inflows into ETFs—which recorded nearly $2.78 billion within just seven days in April 2025—the market experienced its worst quarterly performance since a decade earlier during Q1 of that year with an approximate decline of over11%. Such swings highlight ongoing risks associated with macroeconomic factors such as inflation fears or geopolitical tensions influencing investor behavior globally.
Key Milestones Recap:
- 2009: Creation of Bitcoin
- June 2011: First bull run reaching ~$31
- End of First Bear Market (~mid-2013): Price drops below ~$150
- December 2017: Peak near ~$20K
- December 2018: Bear low around ~$3K
- May 2020: Third halving event reduces supply rate
- April/May 2021: All-time highs approaching ~$65K
- April 2025: Surge nearing ~$95K amid ETF inflows but followed by downturns
Factors Influencing Historical Price Cycles
Bitcoin's cyclical nature is heavily influenced not only by internal network events like halvings but also external factors including:
- Regulatory developments – Governments worldwide continue debating how best to regulate cryptocurrencies.
- Technological progress – Innovations such as Lightning Network improve scalability.
- Investor sentiment – FOMO (Fear Of Missing Out) often drives rapid surges.
- Macroeconomic conditions – Inflation rates or economic crises tend to push demand toward decentralized assets like bitcoin.
Understanding these elements helps explain why periods of rapid growth are often followed by corrections before another upward cycle begins.
Potential Risks & Future Outlook
While recent trends suggest growing institutional confidence reflected through ETF inflows and mainstream acceptance signals positive momentum for bitcoin’s long-term viability—as well as increased liquidity—the inherent volatility remains significant risk factor for investors relying on historical patterns alone.
Market participants should consider scenarios where:
- Regulatory crackdowns could tighten restrictions or ban certain activities,
- Technological setbacks might hinder scalability,
- External shocks could trigger sudden sell-offs similar to past corrections,
- Continued innovation may lead toward more stable valuation models over time,
Monitoring these dynamics is crucial for anyone involved or interested in cryptocurrency markets today.
Final Thoughts on Historical Price Cycles
Bitcoin's journey from fringe digital experiment towards becoming a global asset class exemplifies complex cyclical patterns influenced both internally through protocol adjustments like halvings—and externally via macroeconomic forces and regulation changes. Recognizing these cycles can aid investors’ decision-making processes while emphasizing caution given ongoing volatility risks despite promising growth indicators seen recently through ETF inflows and institutional participation.
By understanding past trends deeply rooted within each cycle phase—from initial emergence through boom-and-bust periods—stakeholders can better navigate future developments within this dynamic landscape shaped continually by technological innovation alongside evolving regulations worldwide.
Disclaimer:Contains third-party content. Not financial advice.
See Terms and Conditions.
What Are Central Bank Digital Currencies (CBDCs)?
Central Bank Digital Currencies (CBDCs) are transforming the landscape of global finance. As digital innovations reshape how we conduct transactions, understanding what CBDCs are and their implications becomes essential for consumers, businesses, and policymakers alike. This article provides a comprehensive overview of CBDCs, exploring their definition, development status worldwide, benefits, challenges, and future prospects.
Understanding CBDCs: Definition and Core Features
CBDCs are digital versions of fiat currencies issued directly by a country's central bank. Unlike cryptocurrencies such as Bitcoin or Ethereum—which operate on decentralized networks—CBDCs are centralized digital currencies backed by the government’s credit. They aim to replicate physical cash in a digital format while leveraging modern technology to enhance security and efficiency.
Key characteristics include:
- Issuer: Central banks issue CBDCs.
- Backing: Fully backed by government authority.
- Control: Managed centrally without decentralization.
- Security Measures: Employ advanced cryptography to prevent counterfeiting.
- Regulatory Compliance: Designed to adhere strictly to AML (Anti-Money Laundering) and KYC (Know Your Customer) regulations.
This structure ensures that CBDCs maintain trustworthiness comparable to traditional fiat currency but with the advantages of digital technology.
Why Are Central Banks Developing Digital Currencies?
The push toward CBDC adoption stems from multiple factors influencing modern economies:
- Digital Payment Growth: The surge in online transactions demands faster and more efficient payment systems.
- Cryptocurrency Trends: The rise of private cryptocurrencies has prompted governments to develop official digital alternatives that can be regulated effectively.
- Financial Inclusion: Many unbanked populations lack access to traditional banking services; CBDCs could bridge this gap by providing accessible digital financial tools via smartphones or other devices.
- Monetary Policy Tools: Digital currencies offer new avenues for central banks to implement monetary policy more precisely.
By embracing these innovations, central banks aim not only at modernization but also at safeguarding monetary sovereignty amid evolving financial ecosystems.
Global Progress on CBDC Implementation
Several countries have made significant strides in developing or piloting their own versions of CBDC:
China’s Digital Yuan
China is arguably leading the world with its pilot program launched in 2020. Known as the e-CNY or digital yuan, it is designed for everyday use alongside physical cash within China’s existing financial infrastructure[1]. The project aims at enhancing transaction speed while maintaining strict regulatory oversight.
European Central Bank's Digital Euro Initiative
The ECB has been exploring a potential euro-based digital currency since 2022[2]. Its focus lies in ensuring compatibility with current banking systems while addressing privacy concerns and regulatory frameworks necessary for widespread adoption across Europe.
United States Federal Reserve Studies
While still in research phases as of 2023[3], the U.S. Federal Reserve is examining how a potential dollar-backed CBDC could influence monetary policy stability without disrupting existing financial markets.
International Collaboration & Guidance
Organizations like the Bank for International Settlements (BIS) facilitate cooperation among central banks worldwide[4]. Their guidance helps harmonize standards around security protocols, interoperability between different national currencies’ blockchain platforms, and regulatory approaches—paving way for smoother cross-border transactions involving multiple jurisdictions' CBDCs.
Benefits Offered by Central Bank Digital Currencies
Implementing a well-designed CBDC can bring numerous advantages:
Enhanced Transaction Efficiency: Faster settlement times reduce delays associated with traditional banking processes.
Reduced Costs: Eliminating intermediaries lowers transaction fees both domestically and internationally.
Improved Financial Inclusion: Providing accessible access points via mobile devices allows underserved populations entry into formal financial systems.
Strengthened Monetary Policy Tools: Real-time data collection enables more precise adjustments based on economic indicators derived from transaction patterns.
Counteracting Private Cryptocurrencies’ Volatility
Furthermore, because they are regulated entities backed by governments rather than decentralized networks prone to volatility like Bitcoin or Ethereum—they provide stability crucial during economic uncertainties.
Challenges & Risks Associated With CBDC Adoption
Despite promising benefits, several hurdles must be addressed before widespread implementation:
Privacy Concerns
As all transactions conducted through a central bank-issued wallet would generate data stored securely under government oversight—raising fears about surveillance capabilities infringing on individual privacy rights[5].
Regulatory Complexities
Adapting existing legal frameworks such as AML/KYC laws requires significant updates; ensuring compliance across borders adds further complexity especially when considering cross-currency operations involving multiple jurisdictions’ regulations[6].
Cybersecurity Threats
Digital assets inherently face risks related to hacking attempts targeting critical infrastructure—necessitating robust cybersecurity measures that evolve alongside technological advancements[7].
Potential Disruption To Banking Sector
If consumers prefer holding funds directly with central banks via wallets rather than commercial banks—a scenario known as disintermediation—it could impact traditional banking models adversely including job losses within retail banking sectors.
Future Outlook & Strategic Considerations
As interest grows globally—with countries like China already piloting programs—the landscape suggests an increasing likelihood that many nations will adopt some form of retail or wholesale CBDC over coming years. Key considerations include:
Ensuring interoperability between different countries' digital currencies facilitates seamless cross-border payments—a vital aspect given globalization trends.[8]
Balancing privacy protections against anti-fraud measures remains critical; transparent yet secure data management policies will shape public trust.[9]
Collaboration among regulators worldwide can help establish common standards reducing fragmentation risks.[10]
Ultimately, successful integration depends on aligning technological innovation with sound regulation while maintaining public confidence through transparency.
Understanding what constitutes a Central Bank Digital Currency reveals its potential transformative impact on global finance—from improving payment efficiency and promoting inclusion to reshaping monetary policy tools—all underpinned by rigorous regulation aimed at safeguarding stability amidst rapid technological change.[11] As developments continue apace across major economies—and international cooperation deepens—the future role of CBDCs promises both opportunities and challenges worth watching closely.
References
- People's Bank of China Official Reports
- European Central Bank Publications
- Federal Reserve Research Papers
- BIS Reports on Cross-Border Payments5–11 Various academic articles discussing privacy issues, cybersecurity threats, regulatory frameworks etc., up-to-date until October 2023
JCUSER-IC8sJL1q
2025-05-11 13:50
What are central bank digital currencies (CBDCs)?
What Are Central Bank Digital Currencies (CBDCs)?
Central Bank Digital Currencies (CBDCs) are transforming the landscape of global finance. As digital innovations reshape how we conduct transactions, understanding what CBDCs are and their implications becomes essential for consumers, businesses, and policymakers alike. This article provides a comprehensive overview of CBDCs, exploring their definition, development status worldwide, benefits, challenges, and future prospects.
Understanding CBDCs: Definition and Core Features
CBDCs are digital versions of fiat currencies issued directly by a country's central bank. Unlike cryptocurrencies such as Bitcoin or Ethereum—which operate on decentralized networks—CBDCs are centralized digital currencies backed by the government’s credit. They aim to replicate physical cash in a digital format while leveraging modern technology to enhance security and efficiency.
Key characteristics include:
- Issuer: Central banks issue CBDCs.
- Backing: Fully backed by government authority.
- Control: Managed centrally without decentralization.
- Security Measures: Employ advanced cryptography to prevent counterfeiting.
- Regulatory Compliance: Designed to adhere strictly to AML (Anti-Money Laundering) and KYC (Know Your Customer) regulations.
This structure ensures that CBDCs maintain trustworthiness comparable to traditional fiat currency but with the advantages of digital technology.
Why Are Central Banks Developing Digital Currencies?
The push toward CBDC adoption stems from multiple factors influencing modern economies:
- Digital Payment Growth: The surge in online transactions demands faster and more efficient payment systems.
- Cryptocurrency Trends: The rise of private cryptocurrencies has prompted governments to develop official digital alternatives that can be regulated effectively.
- Financial Inclusion: Many unbanked populations lack access to traditional banking services; CBDCs could bridge this gap by providing accessible digital financial tools via smartphones or other devices.
- Monetary Policy Tools: Digital currencies offer new avenues for central banks to implement monetary policy more precisely.
By embracing these innovations, central banks aim not only at modernization but also at safeguarding monetary sovereignty amid evolving financial ecosystems.
Global Progress on CBDC Implementation
Several countries have made significant strides in developing or piloting their own versions of CBDC:
China’s Digital Yuan
China is arguably leading the world with its pilot program launched in 2020. Known as the e-CNY or digital yuan, it is designed for everyday use alongside physical cash within China’s existing financial infrastructure[1]. The project aims at enhancing transaction speed while maintaining strict regulatory oversight.
European Central Bank's Digital Euro Initiative
The ECB has been exploring a potential euro-based digital currency since 2022[2]. Its focus lies in ensuring compatibility with current banking systems while addressing privacy concerns and regulatory frameworks necessary for widespread adoption across Europe.
United States Federal Reserve Studies
While still in research phases as of 2023[3], the U.S. Federal Reserve is examining how a potential dollar-backed CBDC could influence monetary policy stability without disrupting existing financial markets.
International Collaboration & Guidance
Organizations like the Bank for International Settlements (BIS) facilitate cooperation among central banks worldwide[4]. Their guidance helps harmonize standards around security protocols, interoperability between different national currencies’ blockchain platforms, and regulatory approaches—paving way for smoother cross-border transactions involving multiple jurisdictions' CBDCs.
Benefits Offered by Central Bank Digital Currencies
Implementing a well-designed CBDC can bring numerous advantages:
Enhanced Transaction Efficiency: Faster settlement times reduce delays associated with traditional banking processes.
Reduced Costs: Eliminating intermediaries lowers transaction fees both domestically and internationally.
Improved Financial Inclusion: Providing accessible access points via mobile devices allows underserved populations entry into formal financial systems.
Strengthened Monetary Policy Tools: Real-time data collection enables more precise adjustments based on economic indicators derived from transaction patterns.
Counteracting Private Cryptocurrencies’ Volatility
Furthermore, because they are regulated entities backed by governments rather than decentralized networks prone to volatility like Bitcoin or Ethereum—they provide stability crucial during economic uncertainties.
Challenges & Risks Associated With CBDC Adoption
Despite promising benefits, several hurdles must be addressed before widespread implementation:
Privacy Concerns
As all transactions conducted through a central bank-issued wallet would generate data stored securely under government oversight—raising fears about surveillance capabilities infringing on individual privacy rights[5].
Regulatory Complexities
Adapting existing legal frameworks such as AML/KYC laws requires significant updates; ensuring compliance across borders adds further complexity especially when considering cross-currency operations involving multiple jurisdictions’ regulations[6].
Cybersecurity Threats
Digital assets inherently face risks related to hacking attempts targeting critical infrastructure—necessitating robust cybersecurity measures that evolve alongside technological advancements[7].
Potential Disruption To Banking Sector
If consumers prefer holding funds directly with central banks via wallets rather than commercial banks—a scenario known as disintermediation—it could impact traditional banking models adversely including job losses within retail banking sectors.
Future Outlook & Strategic Considerations
As interest grows globally—with countries like China already piloting programs—the landscape suggests an increasing likelihood that many nations will adopt some form of retail or wholesale CBDC over coming years. Key considerations include:
Ensuring interoperability between different countries' digital currencies facilitates seamless cross-border payments—a vital aspect given globalization trends.[8]
Balancing privacy protections against anti-fraud measures remains critical; transparent yet secure data management policies will shape public trust.[9]
Collaboration among regulators worldwide can help establish common standards reducing fragmentation risks.[10]
Ultimately, successful integration depends on aligning technological innovation with sound regulation while maintaining public confidence through transparency.
Understanding what constitutes a Central Bank Digital Currency reveals its potential transformative impact on global finance—from improving payment efficiency and promoting inclusion to reshaping monetary policy tools—all underpinned by rigorous regulation aimed at safeguarding stability amidst rapid technological change.[11] As developments continue apace across major economies—and international cooperation deepens—the future role of CBDCs promises both opportunities and challenges worth watching closely.
References
- People's Bank of China Official Reports
- European Central Bank Publications
- Federal Reserve Research Papers
- BIS Reports on Cross-Border Payments5–11 Various academic articles discussing privacy issues, cybersecurity threats, regulatory frameworks etc., up-to-date until October 2023
Disclaimer:Contains third-party content. Not financial advice.
See Terms and Conditions.
How Chikou Span Confirmation Helps Reduce False Signals in Technical Analysis
Understanding how to accurately interpret market signals is essential for traders aiming to make informed decisions. Among various technical indicators, the Chikou Span—an integral part of the Ichimoku Cloud system—stands out for its ability to confirm trends and reduce false signals. This article explores how Chikou Span confirmation enhances trading accuracy, especially in volatile markets like cryptocurrencies.
What Is the Chikou Span and Its Role in Technical Analysis?
The Chikou Span, often called the Lagging Span, is a component of the Ichimoku Cloud indicator suite. It plots the closing price of an asset 26 periods behind its current position on a chart. This lagging aspect helps smooth out short-term price fluctuations, providing traders with a clearer view of overall market momentum.
In practical terms, when analyzing charts, traders observe where the Chikou Span lies relative to past prices and other Ichimoku components. Its position offers insights into whether a trend is strengthening or weakening. For example, if it crosses above past prices or other key levels, it can signal bullish momentum; if it crosses below, bearish conditions may be emerging.
How Does The Chikou Span Confirm Market Trends?
The primary function of the Chikou Span is trend confirmation rather than prediction. When used correctly alongside other elements like Tenkan-Sen (Conversion Line) and Kijun-Sen (Base Line), it provides validation for potential entry or exit points.
For instance:
- Bullish Confirmation: When the current price is above cloud levels and the Chikou Span crosses above past prices around 26 periods ago.
- Bearish Confirmation: Conversely, when prices are below cloud support levels with the Chikoh Span crossing below previous lows.
This cross-verification reduces reliance on single indicators that might generate misleading signals due to short-term volatility or market noise.
Reducing False Signals Through Trend Validation
False signals occur when traders act on misleading cues from technical tools—often caused by sudden spikes or dips that don't reflect true market direction. The strength of using Chiok Spans lies in their ability to filter these noise-induced errors by confirming whether recent price movements align with established trends.
Here’s how this works:
- Smoothing Effect: Since it plots data 26 periods behind, abrupt short-term swings are less likely to trigger false alarms.
- Trend Alignment: A genuine trend will typically show consistent alignment between current prices and where the Chikou Span sits relative to historical data.
- Confirmation Overlap: Combining this with other Ichimoku components ensures that multiple signals agree before executing trades—a practice known as confluence—which significantly minimizes false positives.
By requiring multiple confirmations—such as price position relative to cloud boundaries along with favorable Chiok Spans—the likelihood of acting on deceptive moves diminishes considerably.
Enhancing Trading Strategies With Multiple Indicators
While relying solely on one indicator can be risky—even effective ones like Chiok Spans—they work best within a broader analytical framework. Traders often combine them with additional tools such as moving averages or RSI (Relative Strength Index) for more robust decision-making processes.
For example:
- Using RSI alongside Ichimoku components helps identify overbought or oversold conditions.
- Moving averages can provide dynamic support/resistance levels aligned with trend directions confirmed by Chiok Spans.
This layered approach ensures that each trade decision rests upon multiple layers of evidence rather than isolated signals prone to false alarms—a crucial principle especially relevant in highly volatile markets like cryptocurrencies where rapid shifts are common.
Recent Trends: Cryptocurrency Markets & Advanced Usage
In recent years, cryptocurrency trading has seen increased adoption of advanced technical analysis techniques—including Ichimoku Cloud strategies involving Chiok Spans—to navigate extreme volatility effectively. Traders have reported that incorporating these confirmations reduces whipsaws—erratic reversals caused by fleeting market noise—and improves overall trade accuracy.
Moreover:
- Many crypto traders now integrate Chiok Spans into algorithmic trading systems for real-time validation.
- Online communities actively discuss best practices around combining Ichimoku components with other indicators for optimal results.
However, it's important to recognize limitations: despite its strengths in filtering false signals during trending phases, Chiok Spans may lag during sudden reversals or choppy markets where quick reactions are necessary but delayed confirmation could hinder timely entries/exits.
Potential Limitations And Best Practices
While powerful as part of an integrated strategy, relying exclusively on Chilkou spans carries risks:
- Lagging Nature: As a lagging indicator based on historical data points (26 periods back), it might delay recognition of new trends or reversals.
- Market Conditions Sensitivity: In sideways markets characterized by consolidation phases without clear directional movement—the effectiveness diminishes because both bullish and bearish confirmations become ambiguous.
- Overdependence Risks: Excessive reliance may lead traders into overtrading based solely on confirmed signals without considering fundamental factors or broader context.
To maximize benefits while mitigating drawbacks:
- Use Chilkou spans alongside leading indicators such as candlestick patterns or volume analysis.
- Confirm trends across multiple timeframes before executing trades.
- Remain adaptable; adjust parameters if market conditions shift from trending behavior toward sideways movement.
Improving Trading Accuracy With Effective Use Of Chilkou Spans
Incorporating Chilkou span confirmation into your trading approach enhances reliability by filtering out many common pitfalls associated with false alerts inherent in technical analysis tools alone. By understanding its role within comprehensive strategies—including confluence checks across various indicators—you gain better control over entry/exit timing amid unpredictable markets like cryptocurrencies.
Key Takeaways:
- The Chilkou span acts as a trend confirmer within Ichimoku Cloud analysis
- It helps smooth out short-term volatility effects
- Combining Chilkou span insights with other tools reduces chances of acting on false signals
- Awareness about its lagging nature ensures balanced expectations
- Adaptation according to specific market environments maximizes effectiveness
Implementing these principles allows traders not only improve their confidence but also develop more disciplined approaches grounded in validated technical evidence rather than impulsive reactions driven by fleeting moves—all vital skills for success across diverse financial landscapes today
JCUSER-F1IIaxXA
2025-05-09 08:36
How can Chikou Span confirmation reduce false signals?
How Chikou Span Confirmation Helps Reduce False Signals in Technical Analysis
Understanding how to accurately interpret market signals is essential for traders aiming to make informed decisions. Among various technical indicators, the Chikou Span—an integral part of the Ichimoku Cloud system—stands out for its ability to confirm trends and reduce false signals. This article explores how Chikou Span confirmation enhances trading accuracy, especially in volatile markets like cryptocurrencies.
What Is the Chikou Span and Its Role in Technical Analysis?
The Chikou Span, often called the Lagging Span, is a component of the Ichimoku Cloud indicator suite. It plots the closing price of an asset 26 periods behind its current position on a chart. This lagging aspect helps smooth out short-term price fluctuations, providing traders with a clearer view of overall market momentum.
In practical terms, when analyzing charts, traders observe where the Chikou Span lies relative to past prices and other Ichimoku components. Its position offers insights into whether a trend is strengthening or weakening. For example, if it crosses above past prices or other key levels, it can signal bullish momentum; if it crosses below, bearish conditions may be emerging.
How Does The Chikou Span Confirm Market Trends?
The primary function of the Chikou Span is trend confirmation rather than prediction. When used correctly alongside other elements like Tenkan-Sen (Conversion Line) and Kijun-Sen (Base Line), it provides validation for potential entry or exit points.
For instance:
- Bullish Confirmation: When the current price is above cloud levels and the Chikou Span crosses above past prices around 26 periods ago.
- Bearish Confirmation: Conversely, when prices are below cloud support levels with the Chikoh Span crossing below previous lows.
This cross-verification reduces reliance on single indicators that might generate misleading signals due to short-term volatility or market noise.
Reducing False Signals Through Trend Validation
False signals occur when traders act on misleading cues from technical tools—often caused by sudden spikes or dips that don't reflect true market direction. The strength of using Chiok Spans lies in their ability to filter these noise-induced errors by confirming whether recent price movements align with established trends.
Here’s how this works:
- Smoothing Effect: Since it plots data 26 periods behind, abrupt short-term swings are less likely to trigger false alarms.
- Trend Alignment: A genuine trend will typically show consistent alignment between current prices and where the Chikou Span sits relative to historical data.
- Confirmation Overlap: Combining this with other Ichimoku components ensures that multiple signals agree before executing trades—a practice known as confluence—which significantly minimizes false positives.
By requiring multiple confirmations—such as price position relative to cloud boundaries along with favorable Chiok Spans—the likelihood of acting on deceptive moves diminishes considerably.
Enhancing Trading Strategies With Multiple Indicators
While relying solely on one indicator can be risky—even effective ones like Chiok Spans—they work best within a broader analytical framework. Traders often combine them with additional tools such as moving averages or RSI (Relative Strength Index) for more robust decision-making processes.
For example:
- Using RSI alongside Ichimoku components helps identify overbought or oversold conditions.
- Moving averages can provide dynamic support/resistance levels aligned with trend directions confirmed by Chiok Spans.
This layered approach ensures that each trade decision rests upon multiple layers of evidence rather than isolated signals prone to false alarms—a crucial principle especially relevant in highly volatile markets like cryptocurrencies where rapid shifts are common.
Recent Trends: Cryptocurrency Markets & Advanced Usage
In recent years, cryptocurrency trading has seen increased adoption of advanced technical analysis techniques—including Ichimoku Cloud strategies involving Chiok Spans—to navigate extreme volatility effectively. Traders have reported that incorporating these confirmations reduces whipsaws—erratic reversals caused by fleeting market noise—and improves overall trade accuracy.
Moreover:
- Many crypto traders now integrate Chiok Spans into algorithmic trading systems for real-time validation.
- Online communities actively discuss best practices around combining Ichimoku components with other indicators for optimal results.
However, it's important to recognize limitations: despite its strengths in filtering false signals during trending phases, Chiok Spans may lag during sudden reversals or choppy markets where quick reactions are necessary but delayed confirmation could hinder timely entries/exits.
Potential Limitations And Best Practices
While powerful as part of an integrated strategy, relying exclusively on Chilkou spans carries risks:
- Lagging Nature: As a lagging indicator based on historical data points (26 periods back), it might delay recognition of new trends or reversals.
- Market Conditions Sensitivity: In sideways markets characterized by consolidation phases without clear directional movement—the effectiveness diminishes because both bullish and bearish confirmations become ambiguous.
- Overdependence Risks: Excessive reliance may lead traders into overtrading based solely on confirmed signals without considering fundamental factors or broader context.
To maximize benefits while mitigating drawbacks:
- Use Chilkou spans alongside leading indicators such as candlestick patterns or volume analysis.
- Confirm trends across multiple timeframes before executing trades.
- Remain adaptable; adjust parameters if market conditions shift from trending behavior toward sideways movement.
Improving Trading Accuracy With Effective Use Of Chilkou Spans
Incorporating Chilkou span confirmation into your trading approach enhances reliability by filtering out many common pitfalls associated with false alerts inherent in technical analysis tools alone. By understanding its role within comprehensive strategies—including confluence checks across various indicators—you gain better control over entry/exit timing amid unpredictable markets like cryptocurrencies.
Key Takeaways:
- The Chilkou span acts as a trend confirmer within Ichimoku Cloud analysis
- It helps smooth out short-term volatility effects
- Combining Chilkou span insights with other tools reduces chances of acting on false signals
- Awareness about its lagging nature ensures balanced expectations
- Adaptation according to specific market environments maximizes effectiveness
Implementing these principles allows traders not only improve their confidence but also develop more disciplined approaches grounded in validated technical evidence rather than impulsive reactions driven by fleeting moves—all vital skills for success across diverse financial landscapes today
Disclaimer:Contains third-party content. Not financial advice.
See Terms and Conditions.
How is On-Chain Data Visualized?
Understanding how on-chain data is visualized is essential for anyone interested in blockchain technology, whether you're an investor, developer, or researcher. As blockchain networks generate vast amounts of data daily, transforming this raw information into understandable visuals helps users make informed decisions and gain insights into network health and activity. This article explores the main methods and tools used to visualize on-chain data effectively.
What Is On-Chain Data?
On-chain data encompasses all information stored directly on a blockchain. This includes transaction records, smart contract interactions, token movements, network metrics like block times and gas fees, as well as overall network activity. Because this data is decentralized and transparent by design—meaning anyone can verify transactions—it serves as a reliable source for analysis. However, its sheer volume can be overwhelming without proper visualization techniques.
Why Visualize On-Chain Data?
The exponential growth of blockchain networks has led to an increase in both the quantity and complexity of on-chain data. For users trying to interpret trends or detect anomalies—such as unusual transaction spikes or potential security breaches—visualization becomes indispensable. Well-designed visual representations help distill complex datasets into digestible formats that facilitate quick understanding and better decision-making.
Common Techniques for Visualizing On-Chain Data
There are several key methods used to represent on-chain information visually:
Transaction Volume & Frequency Charts
These graphs display the number of transactions over specific periods (daily or hourly). They reveal patterns such as peak activity times or seasonal fluctuations in network usage.Smart Contract Interaction Graphs
Visualizations showing how often certain smart contracts are called provide insights into dApp popularity and performance trends within decentralized applications (dApps).Network Metrics Dashboards
Metrics like average block time, transaction fees (gas prices), total active addresses, and hash rates are often displayed through line charts or heatmaps to assess network health.Tokenomics Visualization
Charts illustrating token supply distribution—such as pie charts showing holder concentration—or circulation metrics help investors understand market dynamics like scarcity or inflation rates.
Tools & Platforms for On-Chain Data Visualization
A variety of tools have emerged to aid users in visualizing blockchain data efficiently:
- Etherscan: Primarily focused on Ethereum-based networks; offers detailed transaction histories along with smart contract interaction logs.
- Chainalysis: Provides comprehensive analytics dashboards suitable for institutional clients seeking deep insights across multiple chains.
- CryptoSlate: Offers real-time price tracking combined with basic visualization features covering various cryptocurrencies.
- Google Data Studio: A versatile platform allowing analysts to create custom dashboards by importing raw blockchain datasets from APIs or CSV files.
Recent Innovations in Visualization Techniques
The integration of artificial intelligence (AI) and machine learning (ML) has revolutionized how we interpret on-chain data today:
- AI algorithms can automatically identify unusual patterns indicative of potential security threats such as hacks or fraud.
- Machine learning models enhance predictive analytics—for example predicting future transaction volumes based on historical trends.
These advancements enable more accurate anomaly detection while providing deeper insights that were previously difficult due to manual analysis limitations.
Adoption Trends Among Investors & Regulators
Institutional investors increasingly rely on sophisticated visualization tools when evaluating crypto assets because they demand transparency before committing capital. These tools help them assess risks by providing clear views into transactional flows and wallet activities—a critical factor amid growing regulatory scrutiny worldwide.
Regulators also benefit from improved visualization capabilities; transparent representations assist authorities in monitoring compliance with anti-money laundering (AML) standards while ensuring market integrity through clear audit trails embedded within these visualizations.
Potential Challenges & Ethical Considerations
Despite their benefits, there are challenges associated with relying heavily on visualization tools:
• Security Risks: Centralized platforms storing sensitive analytical data could become targets for cyberattacks if not properly secured.• Information Overload: The abundance of available datasets may overwhelm users unless filtering mechanisms are implemented effectively.• Ethical Concerns: AI-driven analyses might introduce biases if training datasets aren’t representative; maintaining transparency about methodologies is crucial for trustworthiness.
Key Facts About On-Chain Data Visualization
To appreciate its importance fully:
– Blockchain networks have expanded rapidly since 2017; this growth correlates directly with increased volume in stored transactional information.– Daily transaction volumes across major chains like Ethereum have surged over 500% since 2020.– Institutional interest continues rising—with many investing heavily in analytics firms specializing in blockchain intelligence—to leverage these visualizations strategically during investment processes.
Timeline Highlights
2017: The surge of initial coin offerings (ICOs) led to a spike in generated chain activity requiring better visualization solutions.*
2020: The COVID pandemic accelerated adoption due to increased digital asset trading.*
2023: AI-powered visualization tools became mainstream components within industry-standard platforms.
Final Thoughts
Visualizing on-chain data transforms complex raw information into actionable insights that support smarter decision-making across the crypto ecosystem—from individual traders analyzing market trends to institutions managing risk exposure—and enhances transparency vital for regulatory compliance. As technological innovations continue advancing—including AI integration—the capacity for more accurate real-time analysis will grow further while addressing current challenges related to security risks and ethical considerations remains essential for building trust within this rapidly evolving space.
JCUSER-WVMdslBw
2025-05-26 17:52
How is on-chain data visualized?
How is On-Chain Data Visualized?
Understanding how on-chain data is visualized is essential for anyone interested in blockchain technology, whether you're an investor, developer, or researcher. As blockchain networks generate vast amounts of data daily, transforming this raw information into understandable visuals helps users make informed decisions and gain insights into network health and activity. This article explores the main methods and tools used to visualize on-chain data effectively.
What Is On-Chain Data?
On-chain data encompasses all information stored directly on a blockchain. This includes transaction records, smart contract interactions, token movements, network metrics like block times and gas fees, as well as overall network activity. Because this data is decentralized and transparent by design—meaning anyone can verify transactions—it serves as a reliable source for analysis. However, its sheer volume can be overwhelming without proper visualization techniques.
Why Visualize On-Chain Data?
The exponential growth of blockchain networks has led to an increase in both the quantity and complexity of on-chain data. For users trying to interpret trends or detect anomalies—such as unusual transaction spikes or potential security breaches—visualization becomes indispensable. Well-designed visual representations help distill complex datasets into digestible formats that facilitate quick understanding and better decision-making.
Common Techniques for Visualizing On-Chain Data
There are several key methods used to represent on-chain information visually:
Transaction Volume & Frequency Charts
These graphs display the number of transactions over specific periods (daily or hourly). They reveal patterns such as peak activity times or seasonal fluctuations in network usage.Smart Contract Interaction Graphs
Visualizations showing how often certain smart contracts are called provide insights into dApp popularity and performance trends within decentralized applications (dApps).Network Metrics Dashboards
Metrics like average block time, transaction fees (gas prices), total active addresses, and hash rates are often displayed through line charts or heatmaps to assess network health.Tokenomics Visualization
Charts illustrating token supply distribution—such as pie charts showing holder concentration—or circulation metrics help investors understand market dynamics like scarcity or inflation rates.
Tools & Platforms for On-Chain Data Visualization
A variety of tools have emerged to aid users in visualizing blockchain data efficiently:
- Etherscan: Primarily focused on Ethereum-based networks; offers detailed transaction histories along with smart contract interaction logs.
- Chainalysis: Provides comprehensive analytics dashboards suitable for institutional clients seeking deep insights across multiple chains.
- CryptoSlate: Offers real-time price tracking combined with basic visualization features covering various cryptocurrencies.
- Google Data Studio: A versatile platform allowing analysts to create custom dashboards by importing raw blockchain datasets from APIs or CSV files.
Recent Innovations in Visualization Techniques
The integration of artificial intelligence (AI) and machine learning (ML) has revolutionized how we interpret on-chain data today:
- AI algorithms can automatically identify unusual patterns indicative of potential security threats such as hacks or fraud.
- Machine learning models enhance predictive analytics—for example predicting future transaction volumes based on historical trends.
These advancements enable more accurate anomaly detection while providing deeper insights that were previously difficult due to manual analysis limitations.
Adoption Trends Among Investors & Regulators
Institutional investors increasingly rely on sophisticated visualization tools when evaluating crypto assets because they demand transparency before committing capital. These tools help them assess risks by providing clear views into transactional flows and wallet activities—a critical factor amid growing regulatory scrutiny worldwide.
Regulators also benefit from improved visualization capabilities; transparent representations assist authorities in monitoring compliance with anti-money laundering (AML) standards while ensuring market integrity through clear audit trails embedded within these visualizations.
Potential Challenges & Ethical Considerations
Despite their benefits, there are challenges associated with relying heavily on visualization tools:
• Security Risks: Centralized platforms storing sensitive analytical data could become targets for cyberattacks if not properly secured.• Information Overload: The abundance of available datasets may overwhelm users unless filtering mechanisms are implemented effectively.• Ethical Concerns: AI-driven analyses might introduce biases if training datasets aren’t representative; maintaining transparency about methodologies is crucial for trustworthiness.
Key Facts About On-Chain Data Visualization
To appreciate its importance fully:
– Blockchain networks have expanded rapidly since 2017; this growth correlates directly with increased volume in stored transactional information.– Daily transaction volumes across major chains like Ethereum have surged over 500% since 2020.– Institutional interest continues rising—with many investing heavily in analytics firms specializing in blockchain intelligence—to leverage these visualizations strategically during investment processes.
Timeline Highlights
2017: The surge of initial coin offerings (ICOs) led to a spike in generated chain activity requiring better visualization solutions.*
2020: The COVID pandemic accelerated adoption due to increased digital asset trading.*
2023: AI-powered visualization tools became mainstream components within industry-standard platforms.
Final Thoughts
Visualizing on-chain data transforms complex raw information into actionable insights that support smarter decision-making across the crypto ecosystem—from individual traders analyzing market trends to institutions managing risk exposure—and enhances transparency vital for regulatory compliance. As technological innovations continue advancing—including AI integration—the capacity for more accurate real-time analysis will grow further while addressing current challenges related to security risks and ethical considerations remains essential for building trust within this rapidly evolving space.
Disclaimer:Contains third-party content. Not financial advice.
See Terms and Conditions.
How to Stay Updated on Emerging Cybersecurity Threats and Vulnerabilities
Understanding the importance of staying informed about the latest cybersecurity threats and vulnerabilities is essential for organizations, security professionals, and individuals alike. As technology advances rapidly—bringing innovations like cloud computing, artificial intelligence (AI), and the Internet of Things (IoT)—cybercriminals also evolve their tactics. Keeping pace with these changes helps in proactively defending digital assets, minimizing risks, and ensuring online safety.
Why Staying Informed Matters in Cybersecurity
Cyber threats are constantly changing, with new vulnerabilities emerging daily. Zero-day exploits—attacks that target undisclosed or unpatched software flaws—have seen a steady increase over recent years. For example, from 2022 to 2024, zero-day incidents rose from 63 to 75 cases annually. Notably, government-backed hackers are responsible for many of these exploits, indicating a sophisticated threat landscape that requires vigilant monitoring.
Staying updated enables organizations to anticipate potential attacks before they happen. It also allows them to implement timely patches and security measures that mitigate risks associated with newly discovered vulnerabilities. In sectors like finance or crypto trading where sensitive data is involved, this proactive approach can prevent significant financial losses or data breaches.
Leveraging Threat Intelligence for Better Defense
Threat intelligence involves collecting data about current cyber threats from various sources such as open-source platforms, commercial feeds, industry reports, and government advisories. The goal is to analyze this information to predict future attack vectors or identify active campaigns targeting specific industries or technologies.
Recent advancements have significantly enhanced threat intelligence capabilities through AI and machine learning integration. These technologies enable security teams to process vast amounts of data efficiently—identifying patterns indicative of malicious activity much faster than manual analysis would allow. For instance:
- AI algorithms can detect unusual network traffic suggesting a breach.
- Machine learning models can classify new malware variants based on known signatures.
By continuously updating threat databases with real-time insights derived from AI tools, organizations gain a strategic advantage against cyber adversaries.
Effective Vulnerability Management Strategies
Vulnerability management remains at the core of cybersecurity defense mechanisms. It involves identifying weaknesses within hardware systems or software applications through regular scans; classifying these vulnerabilities based on severity; then prioritizing remediation efforts accordingly.
However, managing vulnerabilities has become increasingly challenging due to the sheer volume discovered each year—a phenomenon driven by rapid technological innovation and widespread adoption of complex systems like IoT devices and cloud services. Reports indicate an upward trend in vulnerability disclosures annually; thus making it difficult for teams to patch everything promptly without risking operational disruptions.
To address this challenge:
- Implement automated vulnerability scanning tools.
- Maintain an up-to-date asset inventory.
- Establish clear patch management policies.
- Regularly review security configurations across all systems.
These practices help ensure critical flaws are addressed swiftly while reducing exposure windows during which attackers could exploit unpatched weaknesses.
Securing Crypto Assets & Investment Platforms
The rise of cryptocurrencies has introduced unique cybersecurity challenges due to their decentralized nature and high-value transactions stored within exchanges or wallets vulnerable targets for hackers seeking quick gains through thefts or scams.
Crypto exchanges often face targeted attacks exploiting software flaws or social engineering tactics aimed at users’ private keys—the cryptographic credentials needed access funds securely stored offline (cold storage) versus online wallets (hot wallets). Recent incidents underscore the importance of deploying multi-factor authentication (MFA), cold storage solutions when possible—and continuous monitoring—to safeguard digital assets effectively.
Similarly, investment platforms handling sensitive financial data must adopt robust cybersecurity measures such as encryption protocols alongside regular vulnerability assessments—all tailored toward preventing unauthorized access that could lead not only to monetary loss but also reputational damage.
Emerging Trends & Regulatory Developments
The cybersecurity landscape continues evolving rapidly with new solutions entering the market: advanced intrusion detection systems powered by AI; behavioral analytics tools; blockchain-based identity verification methods—and more—all designed for better threat detection capabilities.
Governments worldwide are implementing stricter regulations aimed at improving overall cyber resilience—for example: Europe's GDPR mandates strict data protection standards applicable across industries—which compel organizations not only toward compliance but also toward adopting best practices in risk management strategies aligned with international standards like ISO/IEC 27001.
Staying ahead requires continuous education about regulatory updates alongside technological advancements so businesses can adapt quickly without falling behind compliance deadlines while maintaining effective defenses against emerging threats.
Practical Tips for Staying Up-to-Date on Cyber Threats
To keep pace with evolving cyber risks effectively:
- Subscribe regularly to reputable cybersecurity news outlets such as KrebsOnSecurity or The Hacker News.
- Follow updates from industry-specific forums including ISACA publications or SANS Institute alerts.
- Participate in webinars/webcasts hosted by leading security vendors offering insights into current trends.
- Join professional networks like LinkedIn groups focused on cybersecurity topics.
- Invest in ongoing training certifications such as CISSP®, CEH®, CompTIA Security+® which emphasize current best practices.6.. Use automated alerting tools integrated into your existing security infrastructure that notify you immediately about new vulnerabilities affecting your environment.
Final Thoughts: Building a Culture of Continuous Security Awareness
Staying updated isn’t just about technology—it’s equally about cultivating organizational awareness around emerging threats through training programs emphasizing secure behaviors among employees at all levels—from executives downwards—and fostering a culture where vigilance becomes second nature.
By combining proactive threat intelligence gathering—with its use of cutting-edge AI/ML techniques—with rigorous vulnerability management processes—and staying informed regarding regulatory shifts—you position yourself better against ever-evolving cyber adversaries.
Keywords: cybersecurity updates | emerging threats | zero-day exploits | threat intelligence | vulnerability management | crypto security | online safety tips | regulatory compliance
JCUSER-IC8sJL1q
2025-05-23 01:09
How can you stay updated on emerging threats and vulnerabilities?
How to Stay Updated on Emerging Cybersecurity Threats and Vulnerabilities
Understanding the importance of staying informed about the latest cybersecurity threats and vulnerabilities is essential for organizations, security professionals, and individuals alike. As technology advances rapidly—bringing innovations like cloud computing, artificial intelligence (AI), and the Internet of Things (IoT)—cybercriminals also evolve their tactics. Keeping pace with these changes helps in proactively defending digital assets, minimizing risks, and ensuring online safety.
Why Staying Informed Matters in Cybersecurity
Cyber threats are constantly changing, with new vulnerabilities emerging daily. Zero-day exploits—attacks that target undisclosed or unpatched software flaws—have seen a steady increase over recent years. For example, from 2022 to 2024, zero-day incidents rose from 63 to 75 cases annually. Notably, government-backed hackers are responsible for many of these exploits, indicating a sophisticated threat landscape that requires vigilant monitoring.
Staying updated enables organizations to anticipate potential attacks before they happen. It also allows them to implement timely patches and security measures that mitigate risks associated with newly discovered vulnerabilities. In sectors like finance or crypto trading where sensitive data is involved, this proactive approach can prevent significant financial losses or data breaches.
Leveraging Threat Intelligence for Better Defense
Threat intelligence involves collecting data about current cyber threats from various sources such as open-source platforms, commercial feeds, industry reports, and government advisories. The goal is to analyze this information to predict future attack vectors or identify active campaigns targeting specific industries or technologies.
Recent advancements have significantly enhanced threat intelligence capabilities through AI and machine learning integration. These technologies enable security teams to process vast amounts of data efficiently—identifying patterns indicative of malicious activity much faster than manual analysis would allow. For instance:
- AI algorithms can detect unusual network traffic suggesting a breach.
- Machine learning models can classify new malware variants based on known signatures.
By continuously updating threat databases with real-time insights derived from AI tools, organizations gain a strategic advantage against cyber adversaries.
Effective Vulnerability Management Strategies
Vulnerability management remains at the core of cybersecurity defense mechanisms. It involves identifying weaknesses within hardware systems or software applications through regular scans; classifying these vulnerabilities based on severity; then prioritizing remediation efforts accordingly.
However, managing vulnerabilities has become increasingly challenging due to the sheer volume discovered each year—a phenomenon driven by rapid technological innovation and widespread adoption of complex systems like IoT devices and cloud services. Reports indicate an upward trend in vulnerability disclosures annually; thus making it difficult for teams to patch everything promptly without risking operational disruptions.
To address this challenge:
- Implement automated vulnerability scanning tools.
- Maintain an up-to-date asset inventory.
- Establish clear patch management policies.
- Regularly review security configurations across all systems.
These practices help ensure critical flaws are addressed swiftly while reducing exposure windows during which attackers could exploit unpatched weaknesses.
Securing Crypto Assets & Investment Platforms
The rise of cryptocurrencies has introduced unique cybersecurity challenges due to their decentralized nature and high-value transactions stored within exchanges or wallets vulnerable targets for hackers seeking quick gains through thefts or scams.
Crypto exchanges often face targeted attacks exploiting software flaws or social engineering tactics aimed at users’ private keys—the cryptographic credentials needed access funds securely stored offline (cold storage) versus online wallets (hot wallets). Recent incidents underscore the importance of deploying multi-factor authentication (MFA), cold storage solutions when possible—and continuous monitoring—to safeguard digital assets effectively.
Similarly, investment platforms handling sensitive financial data must adopt robust cybersecurity measures such as encryption protocols alongside regular vulnerability assessments—all tailored toward preventing unauthorized access that could lead not only to monetary loss but also reputational damage.
Emerging Trends & Regulatory Developments
The cybersecurity landscape continues evolving rapidly with new solutions entering the market: advanced intrusion detection systems powered by AI; behavioral analytics tools; blockchain-based identity verification methods—and more—all designed for better threat detection capabilities.
Governments worldwide are implementing stricter regulations aimed at improving overall cyber resilience—for example: Europe's GDPR mandates strict data protection standards applicable across industries—which compel organizations not only toward compliance but also toward adopting best practices in risk management strategies aligned with international standards like ISO/IEC 27001.
Staying ahead requires continuous education about regulatory updates alongside technological advancements so businesses can adapt quickly without falling behind compliance deadlines while maintaining effective defenses against emerging threats.
Practical Tips for Staying Up-to-Date on Cyber Threats
To keep pace with evolving cyber risks effectively:
- Subscribe regularly to reputable cybersecurity news outlets such as KrebsOnSecurity or The Hacker News.
- Follow updates from industry-specific forums including ISACA publications or SANS Institute alerts.
- Participate in webinars/webcasts hosted by leading security vendors offering insights into current trends.
- Join professional networks like LinkedIn groups focused on cybersecurity topics.
- Invest in ongoing training certifications such as CISSP®, CEH®, CompTIA Security+® which emphasize current best practices.6.. Use automated alerting tools integrated into your existing security infrastructure that notify you immediately about new vulnerabilities affecting your environment.
Final Thoughts: Building a Culture of Continuous Security Awareness
Staying updated isn’t just about technology—it’s equally about cultivating organizational awareness around emerging threats through training programs emphasizing secure behaviors among employees at all levels—from executives downwards—and fostering a culture where vigilance becomes second nature.
By combining proactive threat intelligence gathering—with its use of cutting-edge AI/ML techniques—with rigorous vulnerability management processes—and staying informed regarding regulatory shifts—you position yourself better against ever-evolving cyber adversaries.
Keywords: cybersecurity updates | emerging threats | zero-day exploits | threat intelligence | vulnerability management | crypto security | online safety tips | regulatory compliance
Disclaimer:Contains third-party content. Not financial advice.
See Terms and Conditions.
What’s the McClellan Oscillator?
The McClellan Oscillator is a widely used technical analysis tool that helps traders and investors assess the overall health of the stock market by measuring market breadth. Developed in the 1960s by Sherman and Marian McClellan, this indicator provides valuable insights into whether market movements are supported by broad participation across stocks or driven by a few large-cap stocks. Understanding how to interpret this oscillator can enhance your ability to identify potential trend reversals and confirm ongoing market trends.
How Does the McClellan Oscillator Work?
At its core, the McClellan Oscillator calculates the difference between two key components: advancing stocks and declining stocks. It uses data from daily stock exchanges to determine how many stocks are moving higher versus those moving lower. This difference is then smoothed using exponential moving averages (EMAs) to produce a line chart that oscillates above and below zero.
When more stocks are advancing than declining, the oscillator shows positive values, indicating bullish sentiment across broader segments of the market. Conversely, negative readings suggest bearish conditions with more declining stocks than advancing ones. Traders often look for divergences—situations where price action moves contrary to what breadth indicators suggest—as signals of potential trend reversals.
Why Is Market Breadth Important?
Market breadth measures how widespread buying or selling activity is within an index or entire market. A rising index accompanied by strong breadth suggests healthy participation from many stocks, reinforcing bullish momentum. On the other hand, if an index advances while only a handful of large-cap stocks lead it higher—indicated by weak breadth—the rally may lack sustainability.
The McClellan Oscillator serves as an effective gauge of this participation level because it distills complex data about individual stock movements into a single, easy-to-interpret line. This makes it particularly useful for identifying when underlying strength supports or contradicts price trends.
Interpreting Signals from the McClellan Oscillator
Traders primarily use two types of signals from this indicator:
Positive/Negative Readings: When values cross above zero into positive territory, it suggests increasing bullishness; crossing below zero indicates bearish sentiment.
Divergences: If prices reach new highs but the oscillator fails to confirm with similar highs (a divergence), it could signal weakening momentum and potential reversal points.
Additionally, extreme overbought or oversold levels—often identified through specific threshold lines—can alert traders to possible upcoming corrections or rallies before they unfold in price charts.
Recent Trends in Using The McClellan Oscillator
In modern trading environments characterized by rapid information flow and algorithmic strategies, tools like the McClellan Oscillator remain relevant due to their simplicity and effectiveness in capturing broad-market shifts quickly. Many traders incorporate it alongside other technical indicators such as moving averages or RSI (Relative Strength Index) for confirmation purposes.
Furthermore, there’s growing interest in adapting these traditional tools beyond equities—for example, applying similar breadth analysis techniques within cryptocurrency markets despite their high volatility levels. While still experimental due to differing asset dynamics compared with traditional markets, these efforts highlight ongoing innovation driven by trader demand for comprehensive analysis methods.
Limitations & Cautions When Using The Indicator
Despite its usefulness, relying solely on any single technical indicator—including the McClellan Oscillator—can be risky:
Short-term signals: The oscillator tends to generate frequent fluctuations that may not always translate into meaningful long-term trend changes.
Market context: Breadth indicators should be interpreted within broader frameworks including fundamental analysis and macroeconomic factors.
False signals: Divergences can sometimes produce false alarms; therefore combining multiple indicators enhances reliability.
It’s essential for traders—and especially those managing significant portfolios—to understand these limitations before making decisions based solely on oscillators like this one.
Practical Tips for Traders
To maximize effectiveness when using the McClellan Oscillator:
- Watch for crossings above/below zero as initial signs of changing momentum.
- Confirm divergence signals with other technical tools such as volume analysis or trendlines.
- Be cautious during highly volatile periods where false signals are more common.
- Use historical thresholds (e.g., +50/-50) cautiously—they’re helpful but not definitive on their own.
Historical Significance & Notable Usage
Throughout history—including during major events like 2008 financial crisis—the McClellan Oscillator has proven valuable in anticipating shifts before they fully materialize in prices thanks to its focus on underlying market participation rather than just price action alone.
Many experienced traders consider it part of their core toolkit because it offers insight into whether current moves have broad support—a crucial factor when assessing sustainability.
How To Incorporate The MacLeallan Into Your Trading Strategy
Integrating this tool effectively involves understanding both its strengths and limitations:
- Use alongside trend-following systems such as moving averages
- Look for confirmation through volume patterns
- Monitor divergence signs carefully
- Combine with fundamental insights about economic conditions
Final Thoughts: Is The MacLeallan Still Relevant Today?
Yes — despite being over half a century old —the MacLeallan remains relevant because of its straightforward approach toward measuring market health via breadth analysis . Its ability to provide early warnings about potential reversals makes it invaluable especially when combined with modern analytical techniques like algorithmic trading platforms which can process vast amounts of data efficiently .
While adaptations might be necessary when applying similar concepts within emerging markets like cryptocurrencies due to different asset behaviors , understanding traditional tools such as this one forms a solid foundation upon which innovative strategies can be built.
Keywords: MacLeallanOscillator , MarketBreadth , TechnicalAnalysis , StockMarketIndicators , MarketReversals , TradingStrategies , CryptocurrencyAnalysis
JCUSER-IC8sJL1q
2025-05-20 03:29
What’s the McClellan Oscillator?
What’s the McClellan Oscillator?
The McClellan Oscillator is a widely used technical analysis tool that helps traders and investors assess the overall health of the stock market by measuring market breadth. Developed in the 1960s by Sherman and Marian McClellan, this indicator provides valuable insights into whether market movements are supported by broad participation across stocks or driven by a few large-cap stocks. Understanding how to interpret this oscillator can enhance your ability to identify potential trend reversals and confirm ongoing market trends.
How Does the McClellan Oscillator Work?
At its core, the McClellan Oscillator calculates the difference between two key components: advancing stocks and declining stocks. It uses data from daily stock exchanges to determine how many stocks are moving higher versus those moving lower. This difference is then smoothed using exponential moving averages (EMAs) to produce a line chart that oscillates above and below zero.
When more stocks are advancing than declining, the oscillator shows positive values, indicating bullish sentiment across broader segments of the market. Conversely, negative readings suggest bearish conditions with more declining stocks than advancing ones. Traders often look for divergences—situations where price action moves contrary to what breadth indicators suggest—as signals of potential trend reversals.
Why Is Market Breadth Important?
Market breadth measures how widespread buying or selling activity is within an index or entire market. A rising index accompanied by strong breadth suggests healthy participation from many stocks, reinforcing bullish momentum. On the other hand, if an index advances while only a handful of large-cap stocks lead it higher—indicated by weak breadth—the rally may lack sustainability.
The McClellan Oscillator serves as an effective gauge of this participation level because it distills complex data about individual stock movements into a single, easy-to-interpret line. This makes it particularly useful for identifying when underlying strength supports or contradicts price trends.
Interpreting Signals from the McClellan Oscillator
Traders primarily use two types of signals from this indicator:
Positive/Negative Readings: When values cross above zero into positive territory, it suggests increasing bullishness; crossing below zero indicates bearish sentiment.
Divergences: If prices reach new highs but the oscillator fails to confirm with similar highs (a divergence), it could signal weakening momentum and potential reversal points.
Additionally, extreme overbought or oversold levels—often identified through specific threshold lines—can alert traders to possible upcoming corrections or rallies before they unfold in price charts.
Recent Trends in Using The McClellan Oscillator
In modern trading environments characterized by rapid information flow and algorithmic strategies, tools like the McClellan Oscillator remain relevant due to their simplicity and effectiveness in capturing broad-market shifts quickly. Many traders incorporate it alongside other technical indicators such as moving averages or RSI (Relative Strength Index) for confirmation purposes.
Furthermore, there’s growing interest in adapting these traditional tools beyond equities—for example, applying similar breadth analysis techniques within cryptocurrency markets despite their high volatility levels. While still experimental due to differing asset dynamics compared with traditional markets, these efforts highlight ongoing innovation driven by trader demand for comprehensive analysis methods.
Limitations & Cautions When Using The Indicator
Despite its usefulness, relying solely on any single technical indicator—including the McClellan Oscillator—can be risky:
Short-term signals: The oscillator tends to generate frequent fluctuations that may not always translate into meaningful long-term trend changes.
Market context: Breadth indicators should be interpreted within broader frameworks including fundamental analysis and macroeconomic factors.
False signals: Divergences can sometimes produce false alarms; therefore combining multiple indicators enhances reliability.
It’s essential for traders—and especially those managing significant portfolios—to understand these limitations before making decisions based solely on oscillators like this one.
Practical Tips for Traders
To maximize effectiveness when using the McClellan Oscillator:
- Watch for crossings above/below zero as initial signs of changing momentum.
- Confirm divergence signals with other technical tools such as volume analysis or trendlines.
- Be cautious during highly volatile periods where false signals are more common.
- Use historical thresholds (e.g., +50/-50) cautiously—they’re helpful but not definitive on their own.
Historical Significance & Notable Usage
Throughout history—including during major events like 2008 financial crisis—the McClellan Oscillator has proven valuable in anticipating shifts before they fully materialize in prices thanks to its focus on underlying market participation rather than just price action alone.
Many experienced traders consider it part of their core toolkit because it offers insight into whether current moves have broad support—a crucial factor when assessing sustainability.
How To Incorporate The MacLeallan Into Your Trading Strategy
Integrating this tool effectively involves understanding both its strengths and limitations:
- Use alongside trend-following systems such as moving averages
- Look for confirmation through volume patterns
- Monitor divergence signs carefully
- Combine with fundamental insights about economic conditions
Final Thoughts: Is The MacLeallan Still Relevant Today?
Yes — despite being over half a century old —the MacLeallan remains relevant because of its straightforward approach toward measuring market health via breadth analysis . Its ability to provide early warnings about potential reversals makes it invaluable especially when combined with modern analytical techniques like algorithmic trading platforms which can process vast amounts of data efficiently .
While adaptations might be necessary when applying similar concepts within emerging markets like cryptocurrencies due to different asset behaviors , understanding traditional tools such as this one forms a solid foundation upon which innovative strategies can be built.
Keywords: MacLeallanOscillator , MarketBreadth , TechnicalAnalysis , StockMarketIndicators , MarketReversals , TradingStrategies , CryptocurrencyAnalysis
Disclaimer:Contains third-party content. Not financial advice.
See Terms and Conditions.
How Can DMI Be Used to Define Trend Strength Thresholds?
Understanding trend strength is essential for traders and investors aiming to make informed decisions in financial markets, including cryptocurrencies. The Directional Movement Index (DMI), developed by J. Wells Wilder, offers a reliable way to quantify the strength and direction of market trends. By effectively interpreting DMI signals—particularly the ADX line—traders can set meaningful thresholds that help identify when a trend is strong enough to warrant action.
What Is the Directional Movement Index (DMI)?
The DMI comprises three key components: the +DI (Positive Directional Indicator), -DI (Negative Directional Indicator), and ADX (Average Directional Index). The +DI and -DI lines indicate whether an upward or downward movement dominates, providing insight into trend direction. Meanwhile, the ADX measures overall trend strength regardless of direction.
Developed by Wilder in the 1970s, this indicator has stood the test of time due to its simplicity and effectiveness. It helps traders distinguish between trending markets and sideways consolidations—a critical factor for timing entries and exits.
Interpreting ADX Values for Trend Strength
The core utility of DMI lies in its ability to quantify how strong a current trend is through specific threshold levels on the ADX line:
- 0-25: Indicates weak or no clear trend; markets may be ranging.
- 26-50: Signifies developing or moderate trends.
- 51-75: Represents strong trending conditions.
- 76+: Suggests extremely powerful trends with high momentum.
These thresholds serve as practical benchmarks for traders seeking confirmation before executing trades. For example, an ADX crossing above 50 could signal that a significant move is underway, prompting traders to consider entering positions aligned with prevailing momentum.
Setting Effective Trend Strength Thresholds
To leverage DMI effectively, traders often establish specific rules based on these threshold levels:
- When ADX crosses above 25, it may indicate that a new or ongoing trend has gained enough momentum.
- An ADX rising above 50 can be viewed as confirmation of an extremely strong market move—ideal for aggressive trading strategies.
- Conversely, if ADX remains below 25, it suggests low volatility or sideways movement; trading strategies should be cautious during such periods.
Combining these thresholds with other technical indicators enhances decision-making accuracy—for instance:
- Confirming an uptrend when +DI > -DI alongside high ADX values.
- Recognizing potential reversals if +DI crosses below -DI during declining ADX readings.
This layered approach reduces false signals often encountered when relying solely on one indicator.
Enhancing Trend Analysis Through Multi-indicator Strategies
While DMI provides valuable insights into trend strength and direction, integrating it with other tools improves reliability:
- Moving averages can confirm whether price action aligns with identified trends.
- Relative Strength Index (RSI) helps assess overbought or oversold conditions within trending phases indicated by DMI.
For example:
An asset shows an ADX rising above 50 while RSI indicates overbought conditions. This combination might suggest a very strong uptrend nearing exhaustion—prompting caution rather than immediate entry.
Using multiple indicators together ensures more robust analysis aligned with user intent—to confirm genuine breakouts versus false signals caused by market noise.
Recent Trends: AI Integration & Cryptocurrency Markets
In recent years, technological advancements have expanded how traders utilize DMI in practice. Artificial intelligence (AI) algorithms now analyze large datasets—including historical price movements combined with real-time DMI signals—to automate detection of significant trend shifts based on predefined thresholds like those discussed earlier.
This automation allows for quicker responses amid volatile environments such as cryptocurrency markets where rapid changes are common. Cryptocurrencies' inherent volatility makes traditional analysis challenging; however, combining AI-driven models with tools like DMI enhances predictive accuracy regarding emerging trends' strength levels.
Furthermore, community adoption has grown significantly within crypto circles—online forums frequently discuss setting custom threshold levels tailored to specific assets’ behavior patterns rather than rigid standards alone.
Potential Pitfalls When Using DMI Thresholds
Despite its strengths, overreliance on any single indicator—including DMI—can lead to pitfalls such as false signals during sudden market swings or whipsaws in choppy conditions. Market volatility especially impacts cryptocurrencies where abrupt price moves are frequent; thus,
Traders should always corroborate findings from DMI-based thresholds with fundamental analysis, news events,and other technical tools like volume indicators or candlestick patterns.
Additionally,
Regulatory developments can influence how these technical tools are applied across different jurisdictions—for instance,new laws affecting crypto trading might alter typical market behaviors,making previously reliable thresholds less effective temporarily.
Best Practices for Using Trend Thresholds Effectively
To maximize benefits from using DMI-based thresholds:
- Combine multiple indicators rather than relying solely on one metric.
- Adjust threshold levels according to asset-specific behavior; some assets may require higher/lower cutoffs due to their unique volatility profiles.
- Use alerts triggered at key threshold crossings—for example,notifying when ADX surpasses 50—to facilitate timely decision-making without constant monitoring.
By adhering to these practices rooted in sound technical analysis principles—and understanding both their strengths and limitations—you improve your chances of accurately capturing profitable trends while minimizing risks associated with false signals.
Final Thoughts: Applying Knowledge Strategically
Using the Directional Movement Index's threshold levels offers valuable insights into current market dynamics across various asset classes—including cryptocurrencies—and supports strategic trade planning based on quantifiable data points about trend strength and directionality.
By integrating modern technologies like AI-driven analytics alongside traditional methods—and maintaining awareness about potential pitfalls—you position yourself better within competitive markets where timing matters most.
Ultimately,
a disciplined approach combining well-understood indicator thresholds like those provided by the DMI will enhance your ability not only to identify promising opportunities but also manage risk more effectively amidst ever-changing financial landscapes.
JCUSER-WVMdslBw
2025-05-09 11:43
How can DMI be used to define trend strength thresholds?
How Can DMI Be Used to Define Trend Strength Thresholds?
Understanding trend strength is essential for traders and investors aiming to make informed decisions in financial markets, including cryptocurrencies. The Directional Movement Index (DMI), developed by J. Wells Wilder, offers a reliable way to quantify the strength and direction of market trends. By effectively interpreting DMI signals—particularly the ADX line—traders can set meaningful thresholds that help identify when a trend is strong enough to warrant action.
What Is the Directional Movement Index (DMI)?
The DMI comprises three key components: the +DI (Positive Directional Indicator), -DI (Negative Directional Indicator), and ADX (Average Directional Index). The +DI and -DI lines indicate whether an upward or downward movement dominates, providing insight into trend direction. Meanwhile, the ADX measures overall trend strength regardless of direction.
Developed by Wilder in the 1970s, this indicator has stood the test of time due to its simplicity and effectiveness. It helps traders distinguish between trending markets and sideways consolidations—a critical factor for timing entries and exits.
Interpreting ADX Values for Trend Strength
The core utility of DMI lies in its ability to quantify how strong a current trend is through specific threshold levels on the ADX line:
- 0-25: Indicates weak or no clear trend; markets may be ranging.
- 26-50: Signifies developing or moderate trends.
- 51-75: Represents strong trending conditions.
- 76+: Suggests extremely powerful trends with high momentum.
These thresholds serve as practical benchmarks for traders seeking confirmation before executing trades. For example, an ADX crossing above 50 could signal that a significant move is underway, prompting traders to consider entering positions aligned with prevailing momentum.
Setting Effective Trend Strength Thresholds
To leverage DMI effectively, traders often establish specific rules based on these threshold levels:
- When ADX crosses above 25, it may indicate that a new or ongoing trend has gained enough momentum.
- An ADX rising above 50 can be viewed as confirmation of an extremely strong market move—ideal for aggressive trading strategies.
- Conversely, if ADX remains below 25, it suggests low volatility or sideways movement; trading strategies should be cautious during such periods.
Combining these thresholds with other technical indicators enhances decision-making accuracy—for instance:
- Confirming an uptrend when +DI > -DI alongside high ADX values.
- Recognizing potential reversals if +DI crosses below -DI during declining ADX readings.
This layered approach reduces false signals often encountered when relying solely on one indicator.
Enhancing Trend Analysis Through Multi-indicator Strategies
While DMI provides valuable insights into trend strength and direction, integrating it with other tools improves reliability:
- Moving averages can confirm whether price action aligns with identified trends.
- Relative Strength Index (RSI) helps assess overbought or oversold conditions within trending phases indicated by DMI.
For example:
An asset shows an ADX rising above 50 while RSI indicates overbought conditions. This combination might suggest a very strong uptrend nearing exhaustion—prompting caution rather than immediate entry.
Using multiple indicators together ensures more robust analysis aligned with user intent—to confirm genuine breakouts versus false signals caused by market noise.
Recent Trends: AI Integration & Cryptocurrency Markets
In recent years, technological advancements have expanded how traders utilize DMI in practice. Artificial intelligence (AI) algorithms now analyze large datasets—including historical price movements combined with real-time DMI signals—to automate detection of significant trend shifts based on predefined thresholds like those discussed earlier.
This automation allows for quicker responses amid volatile environments such as cryptocurrency markets where rapid changes are common. Cryptocurrencies' inherent volatility makes traditional analysis challenging; however, combining AI-driven models with tools like DMI enhances predictive accuracy regarding emerging trends' strength levels.
Furthermore, community adoption has grown significantly within crypto circles—online forums frequently discuss setting custom threshold levels tailored to specific assets’ behavior patterns rather than rigid standards alone.
Potential Pitfalls When Using DMI Thresholds
Despite its strengths, overreliance on any single indicator—including DMI—can lead to pitfalls such as false signals during sudden market swings or whipsaws in choppy conditions. Market volatility especially impacts cryptocurrencies where abrupt price moves are frequent; thus,
Traders should always corroborate findings from DMI-based thresholds with fundamental analysis, news events,and other technical tools like volume indicators or candlestick patterns.
Additionally,
Regulatory developments can influence how these technical tools are applied across different jurisdictions—for instance,new laws affecting crypto trading might alter typical market behaviors,making previously reliable thresholds less effective temporarily.
Best Practices for Using Trend Thresholds Effectively
To maximize benefits from using DMI-based thresholds:
- Combine multiple indicators rather than relying solely on one metric.
- Adjust threshold levels according to asset-specific behavior; some assets may require higher/lower cutoffs due to their unique volatility profiles.
- Use alerts triggered at key threshold crossings—for example,notifying when ADX surpasses 50—to facilitate timely decision-making without constant monitoring.
By adhering to these practices rooted in sound technical analysis principles—and understanding both their strengths and limitations—you improve your chances of accurately capturing profitable trends while minimizing risks associated with false signals.
Final Thoughts: Applying Knowledge Strategically
Using the Directional Movement Index's threshold levels offers valuable insights into current market dynamics across various asset classes—including cryptocurrencies—and supports strategic trade planning based on quantifiable data points about trend strength and directionality.
By integrating modern technologies like AI-driven analytics alongside traditional methods—and maintaining awareness about potential pitfalls—you position yourself better within competitive markets where timing matters most.
Ultimately,
a disciplined approach combining well-understood indicator thresholds like those provided by the DMI will enhance your ability not only to identify promising opportunities but also manage risk more effectively amidst ever-changing financial landscapes.
Disclaimer:Contains third-party content. Not financial advice.
See Terms and Conditions.
How to Set Stop-Loss Levels Around Chart Patterns in Trading
Effective risk management is essential for successful trading, especially in volatile markets like cryptocurrencies. One of the most important tools traders use to limit potential losses is the stop-loss order. When combined with technical analysis—particularly chart patterns—setting appropriate stop-loss levels can significantly improve trading outcomes. This guide provides a comprehensive overview of how to set stop-loss levels around chart patterns, ensuring you make informed decisions that balance risk and reward.
Understanding Stop-Loss Orders and Their Role in Trading
A stop-loss order is an automatic instruction to sell a security once its price reaches a predetermined level. Its primary purpose is to protect traders from significant losses if the market moves against their position. In practice, setting a well-placed stop-loss helps prevent emotional decision-making during volatile market swings and ensures disciplined trading.
In the context of chart patterns, stop-loss levels are strategically placed based on expected price movements associated with specific formations. Proper placement requires understanding both the pattern's characteristics and current market conditions.
Common Chart Patterns Used for Trade Entries
Chart patterns visually represent historical price movements and help predict future trends when interpreted correctly. Recognizing these formations allows traders to identify potential entry points and determine where to place their stops.
Head and Shoulders
This pattern signals a potential trend reversal from bullish to bearish or vice versa. It features three peaks: a higher middle peak (head) flanked by two lower peaks (shoulders). The neckline connects the lows between these peaks; breaking below this line often indicates further downside movement.
Triangles
Triangles are consolidation patterns formed by converging trendlines connecting higher lows and lower highs:
- Symmetrical Triangle: Indicates indecision; breakout direction suggests future trend.
- Ascending Triangle: Bullish continuation pattern.
- Descending Triangle: Bearish continuation pattern.
Wedges
Wedges resemble triangles but have sloped boundaries indicating strong trending behavior before reversal or continuation:
- Rising Wedge: Usually bearish.
- Falling Wedge: Often bullish.
Reversal Patterns: Double Tops & Bottoms
Double tops suggest an impending downtrend after two failed attempts at breaking resistance, while double bottoms indicate potential upward reversals after testing support twice.
Strategies for Setting Stop-Loss Levels Based on Chart Patterns
Choosing where to place your stop-loss depends on your analysis of each pattern’s structure, volatility considerations, and your risk appetite. There are generally two approaches:
Conservative Approach
This method involves placing stops close enough that minor fluctuations won't trigger them unnecessarily but still provide protection against significant adverse moves:
- For head-and-shoulders: Just below the neckline in a bearish setup.
- For bullish reversal patterns: Slightly below key support levels or recent swing lows.
This approach minimizes losses but may result in more frequent triggers due to normal market noise.
Aggressive Approach
Here, stops are set further away from entry points—just above resistance levels in bearish setups or just below support lines in bullish scenarios—to avoid premature exits caused by minor retracements:
- For bearish breakouts: Slightly above resistance zones.
- For bullish breakouts: Slightly below support zones.
While this reduces false triggers, it exposes traders to larger potential losses if the trade goes wrong quickly.
Incorporating Technical Indicators for Better Stop Placement
Using additional technical tools can enhance your ability to set effective stop-loss levels around chart patterns:
- Moving Averages – Placing stops just beyond key moving average lines (e.g., 50-day MA) can provide dynamic support/resistance references.
- Relative Strength Index (RSI) – Overbought or oversold conditions may influence where you place stops relative to overextension zones.
- Bollinger Bands – These volatility bands help identify extreme price deviations; placing stops outside these bands can prevent being stopped out prematurely during normal fluctuations.
Combining these indicators with chart pattern analysis offers more robust risk management strategies aligned with current market dynamics.
Managing Risks Specific To Cryptocurrency Markets
Cryptocurrency markets are known for their high volatility compared to traditional assets like stocks or forex pairs. This characteristic makes precise stop-loss placement even more critical because sudden gaps or sharp moves can trigger orders unexpectedly—a phenomenon known as "market gaps."
To mitigate such risks:
- Use wider buffers when setting stops around volatile crypto assets
- Monitor news events that could cause sudden price jumps
- Consider using trailing stops that adjust as prices move favorably
Additionally, be cautious about overtrading—placing too many tight-stop orders across multiple positions—which can lead not only into increased transaction costs but also emotional fatigue.
Practical Examples of Setting Stop-Losses Around Chart Patterns
Understanding theoretical concepts becomes clearer through real-world examples:
Bitcoin Head & Shoulders Pattern
In January 2021, Bitcoin formed a head-and-shoulders top on its daily chart—a classic reversal signal indicating possible downside movement toward $30,000 area after confirming breakdown below neckline at approximately $35,000–$36,000 . Traders who anticipated this setup placed their stop-loss just above recent swing highs near $37,500 . When Bitcoin broke beneath $35k , those who had positioned their stops accordingly limited losses effectively .
Ethereum Symmetrical Triangle
In March 2023 , Ethereum displayed a symmetrical triangle formation on weekly charts . Traders expecting an upward breakout placed their protective orders slightly above resistance at around $1 ,500 . Once Ethereum surged past this level , triggered buy signals followed by trailing stops helped lock profits while managing downside risks .
These case studies highlight how aligning technical insights with strategic placement enhances overall trade management.
Best Practices for Effective Stop-Loss Placement
To optimize your use of stop-loss orders around chart patterns:
- Always analyze multiple timeframes before entering trades — longer-term charts provide context while shorter-term charts refine entries
- Avoid setting overly tight stops which might be triggered by normal market noise
- Use recent swing lows/highs as logical reference points
- Adjust your position size according to your risk tolerance — risking no more than 1–2% per trade is advisable
- Regularly review open positions — markets evolve rapidly; adapt your exit strategies accordingly
By integrating disciplined planning with continuous learning about technical developments—including new indicator tools—you build resilience against unpredictable crypto market behavior.
In Summary
Setting effective stop-loss levels around chart patterns combines technical analysis expertise with sound risk management principles tailored specifically for highly volatile markets like cryptocurrencies. Recognizing key formations such as head-and shoulders or triangles enables traders not only better entry timing but also strategic exit planning through well-positioned protective orders—all aimed at safeguarding capital while maximizing profit opportunities within defined risk parameters.
JCUSER-WVMdslBw
2025-05-09 06:17
How do you set stop-loss levels around chart patterns?
How to Set Stop-Loss Levels Around Chart Patterns in Trading
Effective risk management is essential for successful trading, especially in volatile markets like cryptocurrencies. One of the most important tools traders use to limit potential losses is the stop-loss order. When combined with technical analysis—particularly chart patterns—setting appropriate stop-loss levels can significantly improve trading outcomes. This guide provides a comprehensive overview of how to set stop-loss levels around chart patterns, ensuring you make informed decisions that balance risk and reward.
Understanding Stop-Loss Orders and Their Role in Trading
A stop-loss order is an automatic instruction to sell a security once its price reaches a predetermined level. Its primary purpose is to protect traders from significant losses if the market moves against their position. In practice, setting a well-placed stop-loss helps prevent emotional decision-making during volatile market swings and ensures disciplined trading.
In the context of chart patterns, stop-loss levels are strategically placed based on expected price movements associated with specific formations. Proper placement requires understanding both the pattern's characteristics and current market conditions.
Common Chart Patterns Used for Trade Entries
Chart patterns visually represent historical price movements and help predict future trends when interpreted correctly. Recognizing these formations allows traders to identify potential entry points and determine where to place their stops.
Head and Shoulders
This pattern signals a potential trend reversal from bullish to bearish or vice versa. It features three peaks: a higher middle peak (head) flanked by two lower peaks (shoulders). The neckline connects the lows between these peaks; breaking below this line often indicates further downside movement.
Triangles
Triangles are consolidation patterns formed by converging trendlines connecting higher lows and lower highs:
- Symmetrical Triangle: Indicates indecision; breakout direction suggests future trend.
- Ascending Triangle: Bullish continuation pattern.
- Descending Triangle: Bearish continuation pattern.
Wedges
Wedges resemble triangles but have sloped boundaries indicating strong trending behavior before reversal or continuation:
- Rising Wedge: Usually bearish.
- Falling Wedge: Often bullish.
Reversal Patterns: Double Tops & Bottoms
Double tops suggest an impending downtrend after two failed attempts at breaking resistance, while double bottoms indicate potential upward reversals after testing support twice.
Strategies for Setting Stop-Loss Levels Based on Chart Patterns
Choosing where to place your stop-loss depends on your analysis of each pattern’s structure, volatility considerations, and your risk appetite. There are generally two approaches:
Conservative Approach
This method involves placing stops close enough that minor fluctuations won't trigger them unnecessarily but still provide protection against significant adverse moves:
- For head-and-shoulders: Just below the neckline in a bearish setup.
- For bullish reversal patterns: Slightly below key support levels or recent swing lows.
This approach minimizes losses but may result in more frequent triggers due to normal market noise.
Aggressive Approach
Here, stops are set further away from entry points—just above resistance levels in bearish setups or just below support lines in bullish scenarios—to avoid premature exits caused by minor retracements:
- For bearish breakouts: Slightly above resistance zones.
- For bullish breakouts: Slightly below support zones.
While this reduces false triggers, it exposes traders to larger potential losses if the trade goes wrong quickly.
Incorporating Technical Indicators for Better Stop Placement
Using additional technical tools can enhance your ability to set effective stop-loss levels around chart patterns:
- Moving Averages – Placing stops just beyond key moving average lines (e.g., 50-day MA) can provide dynamic support/resistance references.
- Relative Strength Index (RSI) – Overbought or oversold conditions may influence where you place stops relative to overextension zones.
- Bollinger Bands – These volatility bands help identify extreme price deviations; placing stops outside these bands can prevent being stopped out prematurely during normal fluctuations.
Combining these indicators with chart pattern analysis offers more robust risk management strategies aligned with current market dynamics.
Managing Risks Specific To Cryptocurrency Markets
Cryptocurrency markets are known for their high volatility compared to traditional assets like stocks or forex pairs. This characteristic makes precise stop-loss placement even more critical because sudden gaps or sharp moves can trigger orders unexpectedly—a phenomenon known as "market gaps."
To mitigate such risks:
- Use wider buffers when setting stops around volatile crypto assets
- Monitor news events that could cause sudden price jumps
- Consider using trailing stops that adjust as prices move favorably
Additionally, be cautious about overtrading—placing too many tight-stop orders across multiple positions—which can lead not only into increased transaction costs but also emotional fatigue.
Practical Examples of Setting Stop-Losses Around Chart Patterns
Understanding theoretical concepts becomes clearer through real-world examples:
Bitcoin Head & Shoulders Pattern
In January 2021, Bitcoin formed a head-and-shoulders top on its daily chart—a classic reversal signal indicating possible downside movement toward $30,000 area after confirming breakdown below neckline at approximately $35,000–$36,000 . Traders who anticipated this setup placed their stop-loss just above recent swing highs near $37,500 . When Bitcoin broke beneath $35k , those who had positioned their stops accordingly limited losses effectively .
Ethereum Symmetrical Triangle
In March 2023 , Ethereum displayed a symmetrical triangle formation on weekly charts . Traders expecting an upward breakout placed their protective orders slightly above resistance at around $1 ,500 . Once Ethereum surged past this level , triggered buy signals followed by trailing stops helped lock profits while managing downside risks .
These case studies highlight how aligning technical insights with strategic placement enhances overall trade management.
Best Practices for Effective Stop-Loss Placement
To optimize your use of stop-loss orders around chart patterns:
- Always analyze multiple timeframes before entering trades — longer-term charts provide context while shorter-term charts refine entries
- Avoid setting overly tight stops which might be triggered by normal market noise
- Use recent swing lows/highs as logical reference points
- Adjust your position size according to your risk tolerance — risking no more than 1–2% per trade is advisable
- Regularly review open positions — markets evolve rapidly; adapt your exit strategies accordingly
By integrating disciplined planning with continuous learning about technical developments—including new indicator tools—you build resilience against unpredictable crypto market behavior.
In Summary
Setting effective stop-loss levels around chart patterns combines technical analysis expertise with sound risk management principles tailored specifically for highly volatile markets like cryptocurrencies. Recognizing key formations such as head-and shoulders or triangles enables traders not only better entry timing but also strategic exit planning through well-positioned protective orders—all aimed at safeguarding capital while maximizing profit opportunities within defined risk parameters.
Disclaimer:Contains third-party content. Not financial advice.
See Terms and Conditions.
How Does Bitcoin Compare to Other Digital Currencies?
Cryptocurrencies have revolutionized the financial landscape over the past decade, offering decentralized, secure, and innovative alternatives to traditional fiat currencies. Among these digital assets, Bitcoin remains the most prominent and influential. However, understanding how Bitcoin compares to other cryptocurrencies is essential for investors, developers, and policymakers aiming to navigate this rapidly evolving market.
What Is Bitcoin and Why Is It Dominant?
Bitcoin was introduced in 2009 by an anonymous entity known as Satoshi Nakamoto. As the first cryptocurrency, it pioneered blockchain technology—a decentralized ledger that records all transactions transparently and securely. Over time, Bitcoin has established itself as a store of value often referred to as "digital gold," with its market capitalization surpassing $1 trillion as of 2025.
Bitcoin's prominence stems from its pioneering status, widespread adoption, and recognition among institutional investors. Its limited supply—capped at 21 million coins—adds scarcity that can drive demand during periods of economic uncertainty or inflation fears. Despite its popularity, Bitcoin is characterized by high volatility; prices can fluctuate dramatically within short periods due to market sentiment or regulatory news.
Recent developments indicate that Bitcoin's price has approached $95,000 amid inflows into exchange-traded funds (ETFs), with some industry experts predicting potential rises up to $200,000 or more in 2025[1]. This growth underscores both investor confidence and ongoing interest from traditional financial institutions.
Comparing Other Major Digital Currencies
While Bitcoin leads in market capitalization and recognition, numerous other cryptocurrencies serve different purposes within the blockchain ecosystem:
Ethereum (ETH): Launched in 2015 by Vitalik Buterin et al., Ethereum is second only to Bitcoin in terms of market cap. Its primary innovation lies in enabling smart contracts—self-executing agreements coded directly on its blockchain—and decentralized applications (dApps). Ethereum’s versatility makes it a foundation for DeFi projects (Decentralized Finance) and non-fungible tokens (NFTs).
Altcoins: These are alternative cryptocurrencies designed with specific features or use cases. Examples include Litecoin (LTC), which offers faster transaction times; Monero (XMR), emphasizing privacy; Dogecoin (DOGE), initially created as a joke but gaining popularity through community support.
Stablecoins: Unlike volatile assets like BTC or ETH, stablecoins such as USD Coin (USDC) or Tether (USDT) are pegged to fiat currencies like the US dollar. They provide stability for trading pairs on exchanges and act as hedging tools against crypto volatility.
Blockchain Technology: The Backbone of Digital Currencies
At their core lies blockchain technology—a distributed ledger system maintained across multiple nodes worldwide. This architecture ensures transparency since every participant can verify transactions independently while maintaining security through cryptographic algorithms.
Security remains paramount; cryptography protects transaction data from tampering or hacking attempts. However,scalability continues to be a challenge for many blockchains due to increasing transaction volumes.Ongoing research aims at improving throughput without compromising decentralization or security—examples include layer-two solutions like Lightning Network for Bitcoin or Ethereum’s upcoming upgrades such as sharding.
Financial Innovation Driven by Cryptocurrencies
The rise of DeFi platforms exemplifies how digital currencies are transforming traditional finance:
- Lending & Borrowing: Users can lend their crypto holdings for interest.
- Decentralized Exchanges: Trading occurs directly between users without intermediaries.
- Asset Management & Insurance: New protocols facilitate risk management without centralized entities.
Regulatory environments around cryptocurrencies are evolving swiftly worldwide:In recent years,regulators have sought clearer frameworks while balancing innovation with consumer protection.For instance,the U.S.'s repeal of certain IRS rules related to DeFi activities aims at reducing compliance burdens but also raises questions about oversight[5].
Recent Trends Shaping Cryptocurrency Markets
In April 2025,notable collaborations emerged between traditional finance giants and crypto firms:
- Cantor Fitzgerald launched Twenty One Capital alongside Tether and SoftBank Group aimed at acquiring bitcoin investments[3].Meanwhile,high-profile figures like former President Donald Trump have been linked indirectly through stablecoin ventures involving his family’s interests—highlighting how mainstream personalities influence perceptions around digital assets[2].
However,these developments come with risks:regulatory uncertainty could lead markets into volatility spikes;security breaches continue despite technological safeguards;and high-profile involvement may attract scrutiny from authorities seeking stricter oversight measures.
Understanding Risks Versus Opportunities in Cryptocurrency Investment
Investors should weigh potential rewards against inherent risks when considering exposure:
- Volatility remains significant across all digital assets.
- Regulatory shifts could impact liquidity options.
- Security threats persist despite advances in cryptography.Conversely,the rapid growth of institutional participation signals increasing legitimacy—and potentially more stability—in certain segments of the crypto space.
Final Thoughts: The Future Landscape of Digital Currencies
Bitcoin’s dominance provides a benchmark within an expanding universe comprising various altcoins tailored toward specific functionalities—from privacy-focused coins like Monero to programmable platforms like Ethereum. As blockchain technology matures—with improvements addressing scalability issues—the ecosystem will likely become more efficient yet complex.
Moreover,the integration between traditional finance institutions and cryptocurrency markets suggests ongoing mainstream acceptance—but also necessitates vigilant regulation aligned with user protection standards[4]. For anyone interested in this space—from casual investors seeking diversification—to professional stakeholders shaping policy—the key lies in understanding each currency's unique role within this dynamic environment.
References
- Industry forecasts predict bitcoin reaching $200K+ amid ETF inflows — [Source]
- Trump-linked stablecoin deal raises regulatory questions — [Source]
- Cantor Fitzgerald partners with Tether & SoftBank on bitcoin investments — [Source]
- Evolving regulatory landscape impacting cryptocurrency markets — [Source]
- Repeal of IRS 'DeFi Broker Rule' supports innovation — [Source]
Note: All data points reflect information available up until October 2023 but may evolve rapidly given market dynamics.
kai
2025-05-06 08:18
How does Bitcoin compare to other digital currencies?
How Does Bitcoin Compare to Other Digital Currencies?
Cryptocurrencies have revolutionized the financial landscape over the past decade, offering decentralized, secure, and innovative alternatives to traditional fiat currencies. Among these digital assets, Bitcoin remains the most prominent and influential. However, understanding how Bitcoin compares to other cryptocurrencies is essential for investors, developers, and policymakers aiming to navigate this rapidly evolving market.
What Is Bitcoin and Why Is It Dominant?
Bitcoin was introduced in 2009 by an anonymous entity known as Satoshi Nakamoto. As the first cryptocurrency, it pioneered blockchain technology—a decentralized ledger that records all transactions transparently and securely. Over time, Bitcoin has established itself as a store of value often referred to as "digital gold," with its market capitalization surpassing $1 trillion as of 2025.
Bitcoin's prominence stems from its pioneering status, widespread adoption, and recognition among institutional investors. Its limited supply—capped at 21 million coins—adds scarcity that can drive demand during periods of economic uncertainty or inflation fears. Despite its popularity, Bitcoin is characterized by high volatility; prices can fluctuate dramatically within short periods due to market sentiment or regulatory news.
Recent developments indicate that Bitcoin's price has approached $95,000 amid inflows into exchange-traded funds (ETFs), with some industry experts predicting potential rises up to $200,000 or more in 2025[1]. This growth underscores both investor confidence and ongoing interest from traditional financial institutions.
Comparing Other Major Digital Currencies
While Bitcoin leads in market capitalization and recognition, numerous other cryptocurrencies serve different purposes within the blockchain ecosystem:
Ethereum (ETH): Launched in 2015 by Vitalik Buterin et al., Ethereum is second only to Bitcoin in terms of market cap. Its primary innovation lies in enabling smart contracts—self-executing agreements coded directly on its blockchain—and decentralized applications (dApps). Ethereum’s versatility makes it a foundation for DeFi projects (Decentralized Finance) and non-fungible tokens (NFTs).
Altcoins: These are alternative cryptocurrencies designed with specific features or use cases. Examples include Litecoin (LTC), which offers faster transaction times; Monero (XMR), emphasizing privacy; Dogecoin (DOGE), initially created as a joke but gaining popularity through community support.
Stablecoins: Unlike volatile assets like BTC or ETH, stablecoins such as USD Coin (USDC) or Tether (USDT) are pegged to fiat currencies like the US dollar. They provide stability for trading pairs on exchanges and act as hedging tools against crypto volatility.
Blockchain Technology: The Backbone of Digital Currencies
At their core lies blockchain technology—a distributed ledger system maintained across multiple nodes worldwide. This architecture ensures transparency since every participant can verify transactions independently while maintaining security through cryptographic algorithms.
Security remains paramount; cryptography protects transaction data from tampering or hacking attempts. However,scalability continues to be a challenge for many blockchains due to increasing transaction volumes.Ongoing research aims at improving throughput without compromising decentralization or security—examples include layer-two solutions like Lightning Network for Bitcoin or Ethereum’s upcoming upgrades such as sharding.
Financial Innovation Driven by Cryptocurrencies
The rise of DeFi platforms exemplifies how digital currencies are transforming traditional finance:
- Lending & Borrowing: Users can lend their crypto holdings for interest.
- Decentralized Exchanges: Trading occurs directly between users without intermediaries.
- Asset Management & Insurance: New protocols facilitate risk management without centralized entities.
Regulatory environments around cryptocurrencies are evolving swiftly worldwide:In recent years,regulators have sought clearer frameworks while balancing innovation with consumer protection.For instance,the U.S.'s repeal of certain IRS rules related to DeFi activities aims at reducing compliance burdens but also raises questions about oversight[5].
Recent Trends Shaping Cryptocurrency Markets
In April 2025,notable collaborations emerged between traditional finance giants and crypto firms:
- Cantor Fitzgerald launched Twenty One Capital alongside Tether and SoftBank Group aimed at acquiring bitcoin investments[3].Meanwhile,high-profile figures like former President Donald Trump have been linked indirectly through stablecoin ventures involving his family’s interests—highlighting how mainstream personalities influence perceptions around digital assets[2].
However,these developments come with risks:regulatory uncertainty could lead markets into volatility spikes;security breaches continue despite technological safeguards;and high-profile involvement may attract scrutiny from authorities seeking stricter oversight measures.
Understanding Risks Versus Opportunities in Cryptocurrency Investment
Investors should weigh potential rewards against inherent risks when considering exposure:
- Volatility remains significant across all digital assets.
- Regulatory shifts could impact liquidity options.
- Security threats persist despite advances in cryptography.Conversely,the rapid growth of institutional participation signals increasing legitimacy—and potentially more stability—in certain segments of the crypto space.
Final Thoughts: The Future Landscape of Digital Currencies
Bitcoin’s dominance provides a benchmark within an expanding universe comprising various altcoins tailored toward specific functionalities—from privacy-focused coins like Monero to programmable platforms like Ethereum. As blockchain technology matures—with improvements addressing scalability issues—the ecosystem will likely become more efficient yet complex.
Moreover,the integration between traditional finance institutions and cryptocurrency markets suggests ongoing mainstream acceptance—but also necessitates vigilant regulation aligned with user protection standards[4]. For anyone interested in this space—from casual investors seeking diversification—to professional stakeholders shaping policy—the key lies in understanding each currency's unique role within this dynamic environment.
References
- Industry forecasts predict bitcoin reaching $200K+ amid ETF inflows — [Source]
- Trump-linked stablecoin deal raises regulatory questions — [Source]
- Cantor Fitzgerald partners with Tether & SoftBank on bitcoin investments — [Source]
- Evolving regulatory landscape impacting cryptocurrency markets — [Source]
- Repeal of IRS 'DeFi Broker Rule' supports innovation — [Source]
Note: All data points reflect information available up until October 2023 but may evolve rapidly given market dynamics.
Disclaimer:Contains third-party content. Not financial advice.
See Terms and Conditions.
#Render glisse sous sa structure en triangle et approche la zone de demande $3.05–$3.25.
📊 Scénarios à surveiller : ✅ Si ça tient → possible rebond court terme vers $4.00+ 🚀 ❌ Si ça casse → chute probable vers la zone $2.50–$2.70 ⚠️
👉 Selon vous, $RNDR prépare un rebond solide ou une plongée plus profonde ?
#RNDR #AI #CryptoMarkets
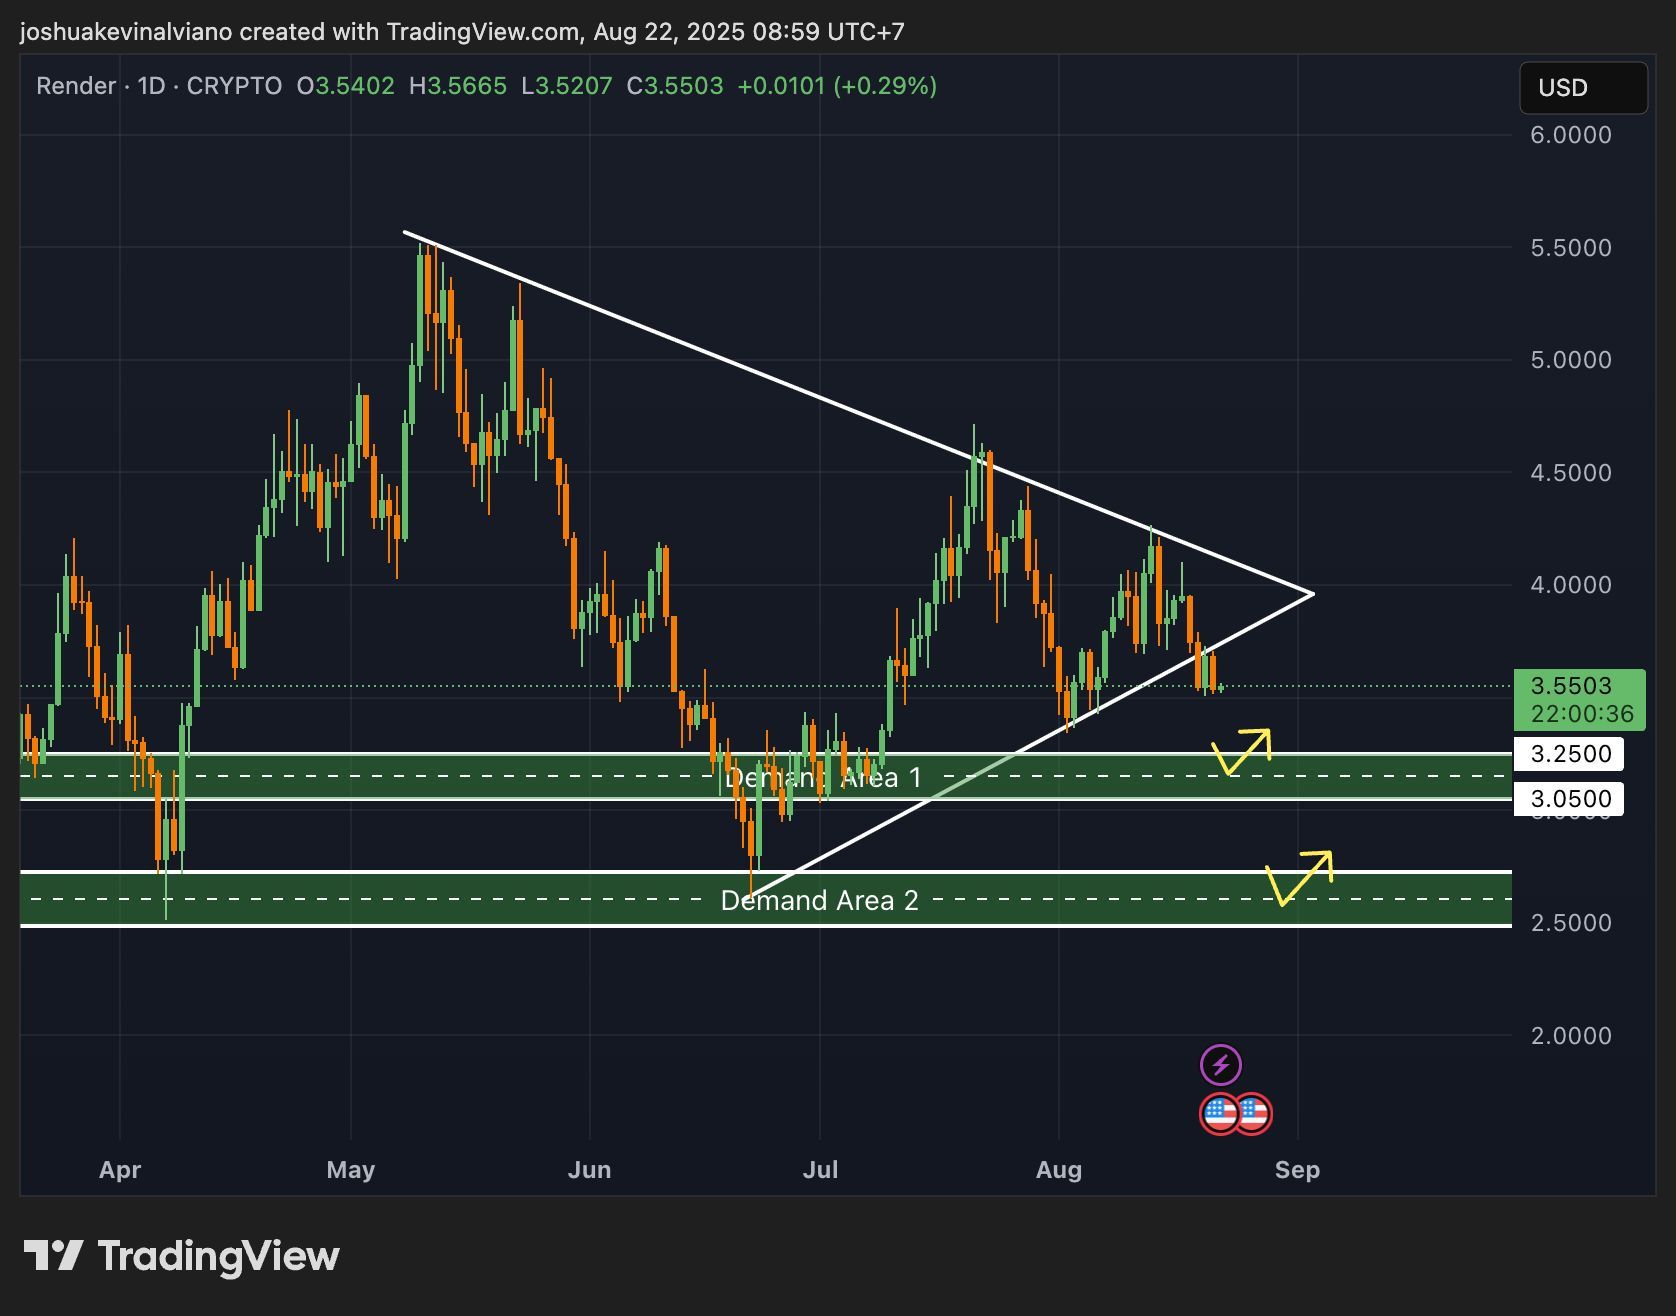

Carmelita
2025-08-22 11:50
$RNDR en zone critique : rebond ou cassure ?
Disclaimer:Contains third-party content. Not financial advice.
See Terms and Conditions.
How Does TradingView’s Community Rank Features?
TradingView has established itself as a leading platform for traders and investors worldwide, thanks to its powerful charting tools, social features, and extensive market data. A key aspect of its success lies in the active participation of its community members who influence the platform’s development through ratings and feedback. Understanding how TradingView's community ranks features provides insight into what drives platform improvements and user satisfaction.
The Role of User Feedback in TradingView
At the core of TradingView’s development process is a robust user feedback mechanism. Users can rate various features based on their experience, functionality, and overall usefulness. This rating system allows the community to express preferences openly, highlighting which tools or features are most valuable or need enhancement.
This participatory approach ensures that TradingView remains aligned with user needs rather than solely relying on internal product decisions. When users consistently give high ratings to certain features—such as advanced indicators or real-time alerts—it signals to developers where resources should be focused for future updates.
Categories of Features Subject to Community Ratings
TradingView organizes its vast array of tools into specific categories that are each subject to community evaluation:
- Charts: Including different types like candlestick charts, line charts, and custom visualizations.
- Indicators: From basic moving averages to complex oscillators.
- Alerts: Customizable notifications based on price movements or indicator signals.
- Community Tools: Social aspects such as chat rooms, discussion forums, and shared trading ideas.
Each category plays a vital role in enhancing trader experience; thus, understanding how users rate these sections helps prioritize feature development effectively.
Recent Developments Driven by Community Feedback
Over recent years, several significant updates have been influenced by community input:
Enhanced Analytics Tools
In response to traders demanding more sophisticated analysis options—especially within volatile markets like cryptocurrencies—TradingView introduced advanced charting capabilities along with new indicators. These enhancements allow traders to perform deeper technical analysis directly within the platform.
Increased Social Engagement Features
Recognizing that social interaction boosts engagement among traders worldwide, TradingView launched live chat rooms and discussion forums around 2022. These additions fostered real-time communication among users sharing trading ideas or strategies—a feature highly rated by active community members seeking collaborative learning environments.
Focus on Cryptocurrency Markets
With cryptocurrencies gaining popularity among retail investors during 2023, TradingView expanded its offerings tailored specifically for crypto analysis. Specialized tools such as crypto-specific indicators and investment strategy templates received positive feedback from this segment's users who rated them highly for usability and relevance.
Challenges: Feature Overload & Balancing User Needs
While continuous improvements benefit many users; they also introduce challenges related to feature overload. As more functionalities are added—sometimes overlapping—the interface can become cluttered or confusing for newcomers trying to navigate complex options quickly.
Additionally, not all user segments prioritize the same features; some may value detailed analytics while others prefer simplicity or social engagement tools. Balancing these diverse needs requires careful prioritization based on community ratings but remains an ongoing challenge for developers aiming at broad appeal without sacrificing depth for advanced traders.
Security Concerns & Trust Maintenance
Given that TradingView handles sensitive financial data—including personal account details and trading activity—the security aspect is paramount in maintaining trust within its community. While not directly tied into feature ranking per se (though security-related features might be rated), addressing vulnerabilities promptly influences overall satisfaction levels significantly.
Community feedback often highlights concerns about data privacy or potential vulnerabilities; responding transparently helps reinforce trustworthiness while guiding necessary security upgrades aligned with user expectations.
How Community Ratings Influence Platform Development
The collective voice of Traders using TradingView shapes what gets prioritized next—from refining existing tools based on low-rated functionalities to introducing entirely new features requested repeatedly by users across different regions or skill levels. This dynamic creates a responsive environment where continuous improvement aligns closely with actual user demands rather than assumptions made solely by product teams.
Final Thoughts: The Power of Collective Input
TradingView’s success hinges heavily on an engaged community willing to share their experiences through ratings and reviews regularly. Their input determines which analytics tools get enhanced first—and which ones might need rethinking altogether—to ensure the platform remains relevant amid evolving market trends like cryptocurrency adoption or increased retail investing activity.
By actively listening—and acting—on this collective feedback loop ensures that both novice traders seeking simplicity and professional investors requiring advanced capabilities find value within one unified ecosystem.
Keywords used include: tradingview feature ranking , tradingview user feedback , best tradingview tools , crypto analysis platforms , social trading communities , technical analysis software
Semantic & LSI keywords: trader ratings system | platform updates driven by user reviews | cryptocurrency trading tools | market analysis platforms | online trader communities
kai
2025-05-26 16:32
How does TradingView’s community rank features?
How Does TradingView’s Community Rank Features?
TradingView has established itself as a leading platform for traders and investors worldwide, thanks to its powerful charting tools, social features, and extensive market data. A key aspect of its success lies in the active participation of its community members who influence the platform’s development through ratings and feedback. Understanding how TradingView's community ranks features provides insight into what drives platform improvements and user satisfaction.
The Role of User Feedback in TradingView
At the core of TradingView’s development process is a robust user feedback mechanism. Users can rate various features based on their experience, functionality, and overall usefulness. This rating system allows the community to express preferences openly, highlighting which tools or features are most valuable or need enhancement.
This participatory approach ensures that TradingView remains aligned with user needs rather than solely relying on internal product decisions. When users consistently give high ratings to certain features—such as advanced indicators or real-time alerts—it signals to developers where resources should be focused for future updates.
Categories of Features Subject to Community Ratings
TradingView organizes its vast array of tools into specific categories that are each subject to community evaluation:
- Charts: Including different types like candlestick charts, line charts, and custom visualizations.
- Indicators: From basic moving averages to complex oscillators.
- Alerts: Customizable notifications based on price movements or indicator signals.
- Community Tools: Social aspects such as chat rooms, discussion forums, and shared trading ideas.
Each category plays a vital role in enhancing trader experience; thus, understanding how users rate these sections helps prioritize feature development effectively.
Recent Developments Driven by Community Feedback
Over recent years, several significant updates have been influenced by community input:
Enhanced Analytics Tools
In response to traders demanding more sophisticated analysis options—especially within volatile markets like cryptocurrencies—TradingView introduced advanced charting capabilities along with new indicators. These enhancements allow traders to perform deeper technical analysis directly within the platform.
Increased Social Engagement Features
Recognizing that social interaction boosts engagement among traders worldwide, TradingView launched live chat rooms and discussion forums around 2022. These additions fostered real-time communication among users sharing trading ideas or strategies—a feature highly rated by active community members seeking collaborative learning environments.
Focus on Cryptocurrency Markets
With cryptocurrencies gaining popularity among retail investors during 2023, TradingView expanded its offerings tailored specifically for crypto analysis. Specialized tools such as crypto-specific indicators and investment strategy templates received positive feedback from this segment's users who rated them highly for usability and relevance.
Challenges: Feature Overload & Balancing User Needs
While continuous improvements benefit many users; they also introduce challenges related to feature overload. As more functionalities are added—sometimes overlapping—the interface can become cluttered or confusing for newcomers trying to navigate complex options quickly.
Additionally, not all user segments prioritize the same features; some may value detailed analytics while others prefer simplicity or social engagement tools. Balancing these diverse needs requires careful prioritization based on community ratings but remains an ongoing challenge for developers aiming at broad appeal without sacrificing depth for advanced traders.
Security Concerns & Trust Maintenance
Given that TradingView handles sensitive financial data—including personal account details and trading activity—the security aspect is paramount in maintaining trust within its community. While not directly tied into feature ranking per se (though security-related features might be rated), addressing vulnerabilities promptly influences overall satisfaction levels significantly.
Community feedback often highlights concerns about data privacy or potential vulnerabilities; responding transparently helps reinforce trustworthiness while guiding necessary security upgrades aligned with user expectations.
How Community Ratings Influence Platform Development
The collective voice of Traders using TradingView shapes what gets prioritized next—from refining existing tools based on low-rated functionalities to introducing entirely new features requested repeatedly by users across different regions or skill levels. This dynamic creates a responsive environment where continuous improvement aligns closely with actual user demands rather than assumptions made solely by product teams.
Final Thoughts: The Power of Collective Input
TradingView’s success hinges heavily on an engaged community willing to share their experiences through ratings and reviews regularly. Their input determines which analytics tools get enhanced first—and which ones might need rethinking altogether—to ensure the platform remains relevant amid evolving market trends like cryptocurrency adoption or increased retail investing activity.
By actively listening—and acting—on this collective feedback loop ensures that both novice traders seeking simplicity and professional investors requiring advanced capabilities find value within one unified ecosystem.
Keywords used include: tradingview feature ranking , tradingview user feedback , best tradingview tools , crypto analysis platforms , social trading communities , technical analysis software
Semantic & LSI keywords: trader ratings system | platform updates driven by user reviews | cryptocurrency trading tools | market analysis platforms | online trader communities
Disclaimer:Contains third-party content. Not financial advice.
See Terms and Conditions.
How to Report Airdrops and Hard-Fork Rewards for Taxes
Understanding how to properly report cryptocurrency airdrops and hard-fork rewards is essential for maintaining compliance with tax laws. As the crypto market evolves, so do the regulations surrounding these events. This guide aims to clarify the key aspects of reporting these types of transactions, ensuring investors can navigate their tax obligations confidently.
What Are Airdrops and Hard-Forks?
Airdrops are a popular method used by blockchain projects to distribute free tokens to users. Typically, recipients receive these tokens as part of promotional campaigns or network upgrades. The main goal is often marketing-driven—encouraging adoption or rewarding early supporters—rather than direct monetary gain at the moment of receipt.
Hard-forks involve significant protocol changes that create a new version of a blockchain. When such forks occur, holders of the original cryptocurrency may automatically receive new tokens associated with the forked chain. These events can lead to complex tax implications because they might be viewed as income or property transfers depending on jurisdictional rules.
Tax Implications of Airdrops
In most countries, including the United States, Canada, and many European nations, cryptocurrencies are classified as property rather than currency. This classification means that any received tokens from an airdrop are considered taxable income at their fair market value (FMV) when received.
For example, if you receive an airdropped token valued at $50 FMV on your receipt date, you must report this amount as ordinary income in your tax return. The challenge lies in accurately determining this FMV since prices can fluctuate rapidly during volatile market conditions.
It's important for taxpayers to keep detailed records—including dates received and valuation sources—to substantiate their reported income if audited by tax authorities.
Tax Treatment of Hard-Fork Rewards
Hard-forks present unique challenges because they may result in new tokens being credited directly into your wallet without any purchase involved. If these newly created assets are considered property under local laws (as is common), then receiving them constitutes taxable income based on their FMV at receipt time.
The key question often revolves around whether you have control over or ownership rights in these new assets immediately after the fork occurs—a factor influencing whether they should be reported as income right away or upon sale later down the line.
In some cases, if you sell or dispose of hard-forked tokens shortly after receiving them, capital gains taxes will apply based on subsequent price changes from initial valuation until disposal.
Recent Regulatory Guidance
Regulatory bodies like the IRS have issued guidance clarifying how taxpayers should handle cryptocurrency transactions involving airdrops and hard-forks:
- IRS (2020): Clarified that virtual currencies are property; thus, receiving tokens through an airdrop or hard-fork counts as taxable income based on FMV at receipt.
- SEC Regulations: Highlighted that certain tokens could be classified as securities depending on their characteristics—impacting how they’re taxed.
- European Union: Recently mandated comprehensive reporting requirements for crypto transactions—including those involving free distributions—to improve transparency and compliance across member states.
Staying updated with such guidance ensures accurate reporting aligned with current legal standards while avoiding penalties due to non-compliance.
Tools & Strategies for Accurate Reporting
Given the complexity involved in tracking multiple transactions like airdrops and forks—which often happen unexpectedly—investors benefit from leveraging specialized tools:
- Cryptocurrency portfolio management software
- Tax calculation platforms tailored for digital assets
- Integration features allowing exportable reports compatible with popular tax filing software
Many exchanges now also provide transaction summaries specifically designed for easier reporting purposes; however, it's crucial always to verify data accuracy independently before submitting returns.
Engaging professional accountants familiar with crypto taxation can further reduce errors—especially when dealing with large holdings or complex event histories—and help optimize tax outcomes legally through strategic planning options available within local law frameworks.
Risks Associated With Non-Reporting
Failing to report cryptocurrency earnings from airdrops or hard-forks exposes investors not only to potential fines but also legal repercussions if authorities determine deliberate evasion occurred. Penalties vary but can include substantial monetary sanctions alongside interest charges on unpaid taxes—and even criminal charges in severe cases involving intentional frauds.
Market volatility adds another layer of risk: since token values fluctuate significantly post-receipt—even within short periods—it’s vital that investors document valuations carefully at each relevant point in time.
Furthermore, regulatory landscapes continue evolving; what qualifies today might change tomorrow due to legislative updates aimed at tightening oversight over digital asset markets.
Staying Compliant Amid Changing Regulations
To ensure ongoing compliance:
- Regularly review updates from relevant authorities like IRS notices or EU directives.
- Maintain meticulous records—including timestamps when receipts occur along with valuation sources.
- Use reputable software solutions designed explicitly for crypto accounting.
- Consult qualified professionals periodically who specialize in digital asset taxation.
By proactively managing documentation and staying informed about regulatory shifts — especially concerning emerging topics like DeFi rewards or NFT-related earnings — investors minimize risks associated with misreporting while optimizing their overall financial health within legal boundaries.
Final Thoughts: Navigating Crypto Tax Reporting Effectively
Reporting airdrop rewards and hard-fork distributions correctly requires understanding both technical aspects and legal obligations tied into your jurisdiction's regulations. While it might seem daunting initially due to fluctuating values and complex event timelines—the use of dedicated tools combined with professional advice simplifies this process considerably.
Remaining vigilant about recent developments ensures compliance while avoiding costly penalties down-the-line—a critical consideration given increasing scrutiny by global regulators aiming toward transparent digital asset markets.
By adopting best practices outlined here—from diligent recordkeeping through leveraging technology—you position yourself well not only legally but also financially within today’s dynamic crypto environment.
Keywords: Cryptocurrency taxation | Airdrop reporting | Hard-fork rewards | Crypto taxes | Digital asset regulation | Capital gains crypto | Tax software for cryptocurrencies

Lo
2025-05-22 12:11
How should you report airdrops and hard-fork rewards for taxes?
How to Report Airdrops and Hard-Fork Rewards for Taxes
Understanding how to properly report cryptocurrency airdrops and hard-fork rewards is essential for maintaining compliance with tax laws. As the crypto market evolves, so do the regulations surrounding these events. This guide aims to clarify the key aspects of reporting these types of transactions, ensuring investors can navigate their tax obligations confidently.
What Are Airdrops and Hard-Forks?
Airdrops are a popular method used by blockchain projects to distribute free tokens to users. Typically, recipients receive these tokens as part of promotional campaigns or network upgrades. The main goal is often marketing-driven—encouraging adoption or rewarding early supporters—rather than direct monetary gain at the moment of receipt.
Hard-forks involve significant protocol changes that create a new version of a blockchain. When such forks occur, holders of the original cryptocurrency may automatically receive new tokens associated with the forked chain. These events can lead to complex tax implications because they might be viewed as income or property transfers depending on jurisdictional rules.
Tax Implications of Airdrops
In most countries, including the United States, Canada, and many European nations, cryptocurrencies are classified as property rather than currency. This classification means that any received tokens from an airdrop are considered taxable income at their fair market value (FMV) when received.
For example, if you receive an airdropped token valued at $50 FMV on your receipt date, you must report this amount as ordinary income in your tax return. The challenge lies in accurately determining this FMV since prices can fluctuate rapidly during volatile market conditions.
It's important for taxpayers to keep detailed records—including dates received and valuation sources—to substantiate their reported income if audited by tax authorities.
Tax Treatment of Hard-Fork Rewards
Hard-forks present unique challenges because they may result in new tokens being credited directly into your wallet without any purchase involved. If these newly created assets are considered property under local laws (as is common), then receiving them constitutes taxable income based on their FMV at receipt time.
The key question often revolves around whether you have control over or ownership rights in these new assets immediately after the fork occurs—a factor influencing whether they should be reported as income right away or upon sale later down the line.
In some cases, if you sell or dispose of hard-forked tokens shortly after receiving them, capital gains taxes will apply based on subsequent price changes from initial valuation until disposal.
Recent Regulatory Guidance
Regulatory bodies like the IRS have issued guidance clarifying how taxpayers should handle cryptocurrency transactions involving airdrops and hard-forks:
- IRS (2020): Clarified that virtual currencies are property; thus, receiving tokens through an airdrop or hard-fork counts as taxable income based on FMV at receipt.
- SEC Regulations: Highlighted that certain tokens could be classified as securities depending on their characteristics—impacting how they’re taxed.
- European Union: Recently mandated comprehensive reporting requirements for crypto transactions—including those involving free distributions—to improve transparency and compliance across member states.
Staying updated with such guidance ensures accurate reporting aligned with current legal standards while avoiding penalties due to non-compliance.
Tools & Strategies for Accurate Reporting
Given the complexity involved in tracking multiple transactions like airdrops and forks—which often happen unexpectedly—investors benefit from leveraging specialized tools:
- Cryptocurrency portfolio management software
- Tax calculation platforms tailored for digital assets
- Integration features allowing exportable reports compatible with popular tax filing software
Many exchanges now also provide transaction summaries specifically designed for easier reporting purposes; however, it's crucial always to verify data accuracy independently before submitting returns.
Engaging professional accountants familiar with crypto taxation can further reduce errors—especially when dealing with large holdings or complex event histories—and help optimize tax outcomes legally through strategic planning options available within local law frameworks.
Risks Associated With Non-Reporting
Failing to report cryptocurrency earnings from airdrops or hard-forks exposes investors not only to potential fines but also legal repercussions if authorities determine deliberate evasion occurred. Penalties vary but can include substantial monetary sanctions alongside interest charges on unpaid taxes—and even criminal charges in severe cases involving intentional frauds.
Market volatility adds another layer of risk: since token values fluctuate significantly post-receipt—even within short periods—it’s vital that investors document valuations carefully at each relevant point in time.
Furthermore, regulatory landscapes continue evolving; what qualifies today might change tomorrow due to legislative updates aimed at tightening oversight over digital asset markets.
Staying Compliant Amid Changing Regulations
To ensure ongoing compliance:
- Regularly review updates from relevant authorities like IRS notices or EU directives.
- Maintain meticulous records—including timestamps when receipts occur along with valuation sources.
- Use reputable software solutions designed explicitly for crypto accounting.
- Consult qualified professionals periodically who specialize in digital asset taxation.
By proactively managing documentation and staying informed about regulatory shifts — especially concerning emerging topics like DeFi rewards or NFT-related earnings — investors minimize risks associated with misreporting while optimizing their overall financial health within legal boundaries.
Final Thoughts: Navigating Crypto Tax Reporting Effectively
Reporting airdrop rewards and hard-fork distributions correctly requires understanding both technical aspects and legal obligations tied into your jurisdiction's regulations. While it might seem daunting initially due to fluctuating values and complex event timelines—the use of dedicated tools combined with professional advice simplifies this process considerably.
Remaining vigilant about recent developments ensures compliance while avoiding costly penalties down-the-line—a critical consideration given increasing scrutiny by global regulators aiming toward transparent digital asset markets.
By adopting best practices outlined here—from diligent recordkeeping through leveraging technology—you position yourself well not only legally but also financially within today’s dynamic crypto environment.
Keywords: Cryptocurrency taxation | Airdrop reporting | Hard-fork rewards | Crypto taxes | Digital asset regulation | Capital gains crypto | Tax software for cryptocurrencies
Disclaimer:Contains third-party content. Not financial advice.
See Terms and Conditions.
Options Greeks Chart: A Complete Guide for Traders and Investors
What Is an Options Greeks Chart?
An options Greeks chart is a vital analytical tool used by traders and investors to understand how various factors influence the price of options. It visually represents key metrics—Delta, Gamma, Theta, and Vega—that measure an option’s sensitivity to underlying asset movements, time decay, and volatility changes. These metrics help traders assess risk exposure, optimize trading strategies, and make informed decisions in both traditional markets like stocks or commodities and emerging sectors such as cryptocurrencies.
The chart consolidates complex mathematical data into an accessible format that allows users to quickly gauge how different market conditions might impact their options positions. By analyzing these sensitivities collectively on a single chart, traders can better anticipate potential profit or loss scenarios under varying circumstances.
The Four Main Components of Options Greeks
Understanding each component of the options Greeks is essential for effective trading:
Delta: This measures how much the price of an option will change with a $1 move in the underlying asset. For example, a Delta of 0.5 indicates that if the stock increases by $1, the option's price will increase by approximately $0.50. Delta also provides insight into whether an option behaves more like a stock (high Delta) or less (low Delta).
Gamma: Gamma indicates how much Delta will change when the underlying asset's price moves by one dollar. It reflects the curvature in the relationship between option prices and underlying prices—higher Gamma means greater sensitivity to small movements in asset prices.
Theta: Often called time decay, Theta quantifies how much value an option loses each day as expiration approaches if all other factors remain constant. For instance, a Theta of -0.05 suggests that daily time decay reduces the option’s value by five cents per day.
Vega: This measures sensitivity to volatility changes; specifically, it shows how much an option's premium will fluctuate with a 1% change in implied volatility of the underlying asset.
These components work together within an options Greeks chart to provide comprehensive insights into potential risks and rewards associated with specific trades.
Why Are Options Greeks Important for Traders?
Options trading involves managing multiple variables simultaneously; therefore understanding these sensitivities is crucial for risk management and strategic planning:
- They enable traders to predict how market movements affect their positions.
- Help determine optimal entry and exit points based on expected changes in volatility or time.
- Facilitate hedging strategies—adjusting portfolios against adverse market shifts.
For example, if you hold long calls with high Delta but low Gamma exposure during volatile periods (like earnings reports), you might want to adjust your position because sudden large moves could significantly impact your profits or losses.
Moreover, institutional investors rely heavily on these metrics for portfolio risk assessment while individual traders use them for tactical decision-making—especially when employing advanced strategies such as spreads or straddles.
Historical Development of Options Greeks
The concept originated during decades when financial mathematicians sought more precise models for pricing derivatives beyond simple formulas like Black-Scholes (1973). In particular:
During 1970s–1980s: Researchers developed sophisticated models incorporating multiple variables influencing options prices.
In 1990s: Emanuel Derman and Nassim Nicholas Taleb popularized terminology—the "Greeks"—to describe these sensitivities systematically.
This evolution allowed both institutional players and retail investors access to tools previously limited due to complexity but now integral across markets worldwide—including equities—and increasingly applied within cryptocurrency derivatives markets where high volatility amplifies importance.
Modern Applications & Recent Trends
In recent years:
Expansion into Cryptocurrency Markets
Cryptocurrencies such as Bitcoin have introduced new opportunities—and challenges—for applying traditional options analysis due to their extreme volatility levels. Traders now utilize Greek-based models tailored specifically toward digital assets’ unique behavior patterns—a development driven partly by increasing institutional interest seeking hedging solutions against crypto exposure.
Advanced Trading Platforms
Modern software offers real-time analytics on Greek values enabling dynamic adjustments during trading sessions rather than static assessments at trade initiation—a significant advantage amid fast-moving markets like crypto exchanges or volatile equity sectors.
Regulatory Environment
Regulatory bodies worldwide are scrutinizing derivatives activities more closely; transparency requirements are increasing which benefits informed trading based on solid Greek analysis while discouraging overly risky leverage practices that could lead to systemic issues if misused.
Risks Associated With Using Options Greeks
While powerful tools:
- Over-reliance can lead traders astray—particularly if they ignore broader market signals.
- High leverage combined with misjudged Greek values may amplify losses rapidly.
- Rapid shifts typical in cryptocurrency markets can cause sudden swings in Greek metrics making real-time monitoring essential but challenging.
Therefore understanding limitations alongside benefits ensures prudent application aligned with sound risk management principles.
Key Dates Shaping Understanding of Options Sensitivities
Tracking historical milestones helps contextualize current practices:
- 1970s–1980s: Development of foundational models like Black-Scholes laid groundwork for calculating initial "Greeks."
- 1990s: Formal naming ("Greeks") brought clarity; expanded understanding among practitioners globally.
- 2010s: Adoption within cryptocurrency derivatives increased awareness about adapting classical models beyond traditional assets.
- 2020s: Integration into advanced platforms enables seamless real-time analysis supporting complex multi-leg strategies across diverse markets.
This timeline underscores ongoing innovation driven by technological advances coupled with evolving financial landscapes.
How To Use An Options Greeks Chart Effectively
To maximize its utility:
- Regularly monitor all four components rather than focusing solely on one metric.
- Adjust positions dynamically based on changing Greek values during market fluctuations.
- Combine Greek analysis with fundamental research about underlying assets' prospects—for example, assessing macroeconomic trends affecting implied volatility (Vega).
By doing so — especially when managing large portfolios — traders can better control downside risks while capitalizing on favorable moves.
Final Thoughts
An options Greeks chart remains indispensable within modern financial analysis frameworks due its ability to distill complex derivative sensitivities into actionable insights. Whether applied traditionally across stocks or innovatively within cryptocurrencies' high-volatility environment—the core principles remain relevant today as they did decades ago—with continuous advancements enhancing accessibility through technology-driven solutions.
Understanding these metrics thoroughly empowers traders not only through improved decision-making but also fosters deeper trustworthiness grounded in quantitative rigor—a cornerstone principle aligning well with expert-level investment standards aimed at sustainable success over time.
JCUSER-WVMdslBw
2025-05-19 07:19
What is Options Greeks Chart?
Options Greeks Chart: A Complete Guide for Traders and Investors
What Is an Options Greeks Chart?
An options Greeks chart is a vital analytical tool used by traders and investors to understand how various factors influence the price of options. It visually represents key metrics—Delta, Gamma, Theta, and Vega—that measure an option’s sensitivity to underlying asset movements, time decay, and volatility changes. These metrics help traders assess risk exposure, optimize trading strategies, and make informed decisions in both traditional markets like stocks or commodities and emerging sectors such as cryptocurrencies.
The chart consolidates complex mathematical data into an accessible format that allows users to quickly gauge how different market conditions might impact their options positions. By analyzing these sensitivities collectively on a single chart, traders can better anticipate potential profit or loss scenarios under varying circumstances.
The Four Main Components of Options Greeks
Understanding each component of the options Greeks is essential for effective trading:
Delta: This measures how much the price of an option will change with a $1 move in the underlying asset. For example, a Delta of 0.5 indicates that if the stock increases by $1, the option's price will increase by approximately $0.50. Delta also provides insight into whether an option behaves more like a stock (high Delta) or less (low Delta).
Gamma: Gamma indicates how much Delta will change when the underlying asset's price moves by one dollar. It reflects the curvature in the relationship between option prices and underlying prices—higher Gamma means greater sensitivity to small movements in asset prices.
Theta: Often called time decay, Theta quantifies how much value an option loses each day as expiration approaches if all other factors remain constant. For instance, a Theta of -0.05 suggests that daily time decay reduces the option’s value by five cents per day.
Vega: This measures sensitivity to volatility changes; specifically, it shows how much an option's premium will fluctuate with a 1% change in implied volatility of the underlying asset.
These components work together within an options Greeks chart to provide comprehensive insights into potential risks and rewards associated with specific trades.
Why Are Options Greeks Important for Traders?
Options trading involves managing multiple variables simultaneously; therefore understanding these sensitivities is crucial for risk management and strategic planning:
- They enable traders to predict how market movements affect their positions.
- Help determine optimal entry and exit points based on expected changes in volatility or time.
- Facilitate hedging strategies—adjusting portfolios against adverse market shifts.
For example, if you hold long calls with high Delta but low Gamma exposure during volatile periods (like earnings reports), you might want to adjust your position because sudden large moves could significantly impact your profits or losses.
Moreover, institutional investors rely heavily on these metrics for portfolio risk assessment while individual traders use them for tactical decision-making—especially when employing advanced strategies such as spreads or straddles.
Historical Development of Options Greeks
The concept originated during decades when financial mathematicians sought more precise models for pricing derivatives beyond simple formulas like Black-Scholes (1973). In particular:
During 1970s–1980s: Researchers developed sophisticated models incorporating multiple variables influencing options prices.
In 1990s: Emanuel Derman and Nassim Nicholas Taleb popularized terminology—the "Greeks"—to describe these sensitivities systematically.
This evolution allowed both institutional players and retail investors access to tools previously limited due to complexity but now integral across markets worldwide—including equities—and increasingly applied within cryptocurrency derivatives markets where high volatility amplifies importance.
Modern Applications & Recent Trends
In recent years:
Expansion into Cryptocurrency Markets
Cryptocurrencies such as Bitcoin have introduced new opportunities—and challenges—for applying traditional options analysis due to their extreme volatility levels. Traders now utilize Greek-based models tailored specifically toward digital assets’ unique behavior patterns—a development driven partly by increasing institutional interest seeking hedging solutions against crypto exposure.
Advanced Trading Platforms
Modern software offers real-time analytics on Greek values enabling dynamic adjustments during trading sessions rather than static assessments at trade initiation—a significant advantage amid fast-moving markets like crypto exchanges or volatile equity sectors.
Regulatory Environment
Regulatory bodies worldwide are scrutinizing derivatives activities more closely; transparency requirements are increasing which benefits informed trading based on solid Greek analysis while discouraging overly risky leverage practices that could lead to systemic issues if misused.
Risks Associated With Using Options Greeks
While powerful tools:
- Over-reliance can lead traders astray—particularly if they ignore broader market signals.
- High leverage combined with misjudged Greek values may amplify losses rapidly.
- Rapid shifts typical in cryptocurrency markets can cause sudden swings in Greek metrics making real-time monitoring essential but challenging.
Therefore understanding limitations alongside benefits ensures prudent application aligned with sound risk management principles.
Key Dates Shaping Understanding of Options Sensitivities
Tracking historical milestones helps contextualize current practices:
- 1970s–1980s: Development of foundational models like Black-Scholes laid groundwork for calculating initial "Greeks."
- 1990s: Formal naming ("Greeks") brought clarity; expanded understanding among practitioners globally.
- 2010s: Adoption within cryptocurrency derivatives increased awareness about adapting classical models beyond traditional assets.
- 2020s: Integration into advanced platforms enables seamless real-time analysis supporting complex multi-leg strategies across diverse markets.
This timeline underscores ongoing innovation driven by technological advances coupled with evolving financial landscapes.
How To Use An Options Greeks Chart Effectively
To maximize its utility:
- Regularly monitor all four components rather than focusing solely on one metric.
- Adjust positions dynamically based on changing Greek values during market fluctuations.
- Combine Greek analysis with fundamental research about underlying assets' prospects—for example, assessing macroeconomic trends affecting implied volatility (Vega).
By doing so — especially when managing large portfolios — traders can better control downside risks while capitalizing on favorable moves.
Final Thoughts
An options Greeks chart remains indispensable within modern financial analysis frameworks due its ability to distill complex derivative sensitivities into actionable insights. Whether applied traditionally across stocks or innovatively within cryptocurrencies' high-volatility environment—the core principles remain relevant today as they did decades ago—with continuous advancements enhancing accessibility through technology-driven solutions.
Understanding these metrics thoroughly empowers traders not only through improved decision-making but also fosters deeper trustworthiness grounded in quantitative rigor—a cornerstone principle aligning well with expert-level investment standards aimed at sustainable success over time.
Disclaimer:Contains third-party content. Not financial advice.
See Terms and Conditions.
What Is a Hard Fork in Blockchain Technology?
A hard fork is one of the most significant and often controversial events in the blockchain ecosystem. It involves making substantial changes to a blockchain’s protocol that result in creating an entirely new, incompatible version of the original chain. Unlike soft forks, which are backward-compatible and do not split the network, hard forks require all nodes—computers running the blockchain software—to upgrade to the new version. Failure to do so can lead to network splits or chain divisions.
Understanding what a hard fork entails is essential for anyone interested in blockchain technology, whether you're an investor, developer, or enthusiast. It highlights how decentralized networks evolve and adapt through community consensus and technical upgrades.
Why Do Blockchains Undergo Hard Forks?
Hard forks are typically driven by community needs for major improvements or changes that cannot be implemented within existing protocols without risking incompatibility. Common reasons include:
- Increasing Block Size: To handle more transactions per block (e.g., Bitcoin Cash increased from 1MB to 8MB).
- Changing Consensus Algorithms: Transitioning from Proof of Work (PoW) to Proof of Stake (PoS) or other mechanisms.
- Adding New Features: Introducing smart contract capabilities or privacy enhancements.
- Fixing Critical Security Flaws: Addressing vulnerabilities that could compromise network integrity.
These upgrades often reflect broader goals such as scalability, security enhancement, decentralization improvements, or feature expansion.
The Mechanics Behind a Hard Fork
A hard fork fundamentally alters certain rules within a blockchain’s protocol. When developers decide on such an upgrade:
- They create a new version of the software with updated rules.
- The community must agree on adopting this new version.
- Nodes need to upgrade their software; otherwise, they remain on the old chain.
Once activated at a predetermined block height—a specific point in time—the network splits into two: one following the old rules and another adhering to the new protocol. If enough participants support it, this results in two separate blockchains operating independently but sharing history up until the split point.
Incompatibility is key here: nodes running outdated versions will no longer validate transactions on the upgraded chain because they do not recognize its rules as valid anymore.
Community Involvement and Decision-Making
Deciding whether to implement a hard fork usually involves extensive discussions among developers and stakeholders within each project’s community—miners, validators, investors, users—and sometimes external experts. This process can be contentious because it directly impacts trustworthiness and decentralization principles inherent in blockchain systems.
For example:
- If stakeholders disagree about proposed changes—such as increasing transaction capacity—they might choose different paths leading to multiple chains.
- Community consensus plays a vital role; without broad support for upgrades like these can cause fragmentation rather than unified progress.
Potential Risks Associated With Hard Forks
While hard forks enable significant advancements—they also carry notable risks:
Chain Splits: The most visible consequence is creating two distinct chains with separate histories post-fork—like Bitcoin (BTC) splitting into Bitcoin Cash (BCH). This can confuse users regarding which chain holds real value or legitimacy.
Community Divisions: Disagreements over protocol changes often lead some factions supporting one version over another—potentially weakening overall project cohesion and trustworthiness among users.
Market Volatility: Cryptocurrency markets tend to react strongly around hard forks due to uncertainty about future value propositions; prices may fluctuate wildly during these periods.
Technical Challenges: Upgrading nodes across diverse hardware setups requires coordination; failure here could result in orphaned blocks or reduced security if some participants lag behind during transition phases.
Notable Examples of Hard Forks
Several high-profile instances illustrate how impactful these events can be:
Bitcoin Cash (2017): One of history’s most famous examples where Bitcoin's community split over scaling issues by increasing block size limits from 1MB up to 8MB—to improve transaction speed and reduce fees.
Ethereum's Istanbul Hard Fork (2019): Implemented multiple updates aimed at improving scalability while reducing gas costs associated with executing smart contracts—a crucial step toward Ethereum's broader adoption as a decentralized platform.
Polkadot Relay Chain Upgrade (2020): Enhanced interoperability between different blockchains while boosting security measures—a core feature aligning with Polkadot’s mission as an interconnected ecosystem.
Cardano's Alonzo Hard Fork (2021): Marked Cardano's entry into smart contract functionality—significantly expanding its potential use cases beyond simple transactions.
Impacts on Users & Investors
For everyday users and investors alike, understanding how hard forks influence their holdings is critical:
Ownership & Value: When chains split after a fork like BCH/BTC or ETH/ETH Classic), holders typically receive equivalent tokens on both chains proportional to their holdings before divergence—in many cases leading traders into arbitrage opportunities but also adding complexity regarding which chain holds true value over time.
Security & Trust: Successful upgrades strengthen confidence if well-executed but failures may undermine trust if they cause prolonged instability or confusion among stakeholders.
Navigating Future Developments
As blockchain technology continues evolving rapidly—with ongoing debates about scalability solutions like layer-two protocols—the role of planned future hard forks remains central yet contentious within communities aiming for decentralization without sacrificing performance gains.
Every stakeholder—from miners securing networks through computational workforces—to developers building innovative features must stay informed about upcoming protocol upgrades involving potential hard forks. These events shape not only technological progress but also market dynamics across cryptocurrency ecosystems.
By understanding what constitutes a hard fork—including its causes, mechanics, risks—and reviewing recent examples you gain insight into how fundamental shifts occur within decentralized networks—and why careful planning coupled with broad consensus remains essential for sustainable growth.
kai
2025-05-15 02:51
What is a hard fork?
What Is a Hard Fork in Blockchain Technology?
A hard fork is one of the most significant and often controversial events in the blockchain ecosystem. It involves making substantial changes to a blockchain’s protocol that result in creating an entirely new, incompatible version of the original chain. Unlike soft forks, which are backward-compatible and do not split the network, hard forks require all nodes—computers running the blockchain software—to upgrade to the new version. Failure to do so can lead to network splits or chain divisions.
Understanding what a hard fork entails is essential for anyone interested in blockchain technology, whether you're an investor, developer, or enthusiast. It highlights how decentralized networks evolve and adapt through community consensus and technical upgrades.
Why Do Blockchains Undergo Hard Forks?
Hard forks are typically driven by community needs for major improvements or changes that cannot be implemented within existing protocols without risking incompatibility. Common reasons include:
- Increasing Block Size: To handle more transactions per block (e.g., Bitcoin Cash increased from 1MB to 8MB).
- Changing Consensus Algorithms: Transitioning from Proof of Work (PoW) to Proof of Stake (PoS) or other mechanisms.
- Adding New Features: Introducing smart contract capabilities or privacy enhancements.
- Fixing Critical Security Flaws: Addressing vulnerabilities that could compromise network integrity.
These upgrades often reflect broader goals such as scalability, security enhancement, decentralization improvements, or feature expansion.
The Mechanics Behind a Hard Fork
A hard fork fundamentally alters certain rules within a blockchain’s protocol. When developers decide on such an upgrade:
- They create a new version of the software with updated rules.
- The community must agree on adopting this new version.
- Nodes need to upgrade their software; otherwise, they remain on the old chain.
Once activated at a predetermined block height—a specific point in time—the network splits into two: one following the old rules and another adhering to the new protocol. If enough participants support it, this results in two separate blockchains operating independently but sharing history up until the split point.
Incompatibility is key here: nodes running outdated versions will no longer validate transactions on the upgraded chain because they do not recognize its rules as valid anymore.
Community Involvement and Decision-Making
Deciding whether to implement a hard fork usually involves extensive discussions among developers and stakeholders within each project’s community—miners, validators, investors, users—and sometimes external experts. This process can be contentious because it directly impacts trustworthiness and decentralization principles inherent in blockchain systems.
For example:
- If stakeholders disagree about proposed changes—such as increasing transaction capacity—they might choose different paths leading to multiple chains.
- Community consensus plays a vital role; without broad support for upgrades like these can cause fragmentation rather than unified progress.
Potential Risks Associated With Hard Forks
While hard forks enable significant advancements—they also carry notable risks:
Chain Splits: The most visible consequence is creating two distinct chains with separate histories post-fork—like Bitcoin (BTC) splitting into Bitcoin Cash (BCH). This can confuse users regarding which chain holds real value or legitimacy.
Community Divisions: Disagreements over protocol changes often lead some factions supporting one version over another—potentially weakening overall project cohesion and trustworthiness among users.
Market Volatility: Cryptocurrency markets tend to react strongly around hard forks due to uncertainty about future value propositions; prices may fluctuate wildly during these periods.
Technical Challenges: Upgrading nodes across diverse hardware setups requires coordination; failure here could result in orphaned blocks or reduced security if some participants lag behind during transition phases.
Notable Examples of Hard Forks
Several high-profile instances illustrate how impactful these events can be:
Bitcoin Cash (2017): One of history’s most famous examples where Bitcoin's community split over scaling issues by increasing block size limits from 1MB up to 8MB—to improve transaction speed and reduce fees.
Ethereum's Istanbul Hard Fork (2019): Implemented multiple updates aimed at improving scalability while reducing gas costs associated with executing smart contracts—a crucial step toward Ethereum's broader adoption as a decentralized platform.
Polkadot Relay Chain Upgrade (2020): Enhanced interoperability between different blockchains while boosting security measures—a core feature aligning with Polkadot’s mission as an interconnected ecosystem.
Cardano's Alonzo Hard Fork (2021): Marked Cardano's entry into smart contract functionality—significantly expanding its potential use cases beyond simple transactions.
Impacts on Users & Investors
For everyday users and investors alike, understanding how hard forks influence their holdings is critical:
Ownership & Value: When chains split after a fork like BCH/BTC or ETH/ETH Classic), holders typically receive equivalent tokens on both chains proportional to their holdings before divergence—in many cases leading traders into arbitrage opportunities but also adding complexity regarding which chain holds true value over time.
Security & Trust: Successful upgrades strengthen confidence if well-executed but failures may undermine trust if they cause prolonged instability or confusion among stakeholders.
Navigating Future Developments
As blockchain technology continues evolving rapidly—with ongoing debates about scalability solutions like layer-two protocols—the role of planned future hard forks remains central yet contentious within communities aiming for decentralization without sacrificing performance gains.
Every stakeholder—from miners securing networks through computational workforces—to developers building innovative features must stay informed about upcoming protocol upgrades involving potential hard forks. These events shape not only technological progress but also market dynamics across cryptocurrency ecosystems.
By understanding what constitutes a hard fork—including its causes, mechanics, risks—and reviewing recent examples you gain insight into how fundamental shifts occur within decentralized networks—and why careful planning coupled with broad consensus remains essential for sustainable growth.
Disclaimer:Contains third-party content. Not financial advice.
See Terms and Conditions.
What Are Child-Pays-for-Parent (CPFP) Transactions?
Understanding CPFP Transactions in Cryptocurrency Networks
Child-Pays-for-Parent (CPFP) transactions are an innovative method used within Bitcoin and other blockchain networks to optimize transaction confirmation times and manage fees effectively. This technique allows a smaller, secondary transaction—called the child—to pay the necessary fees for a primary, or parent, transaction that might otherwise remain unconfirmed due to insufficient fee payments. Essentially, CPFP creates a link between two transactions so that miners are incentivized to confirm both simultaneously, ensuring faster processing of delayed or low-fee transactions.
This mechanism is particularly relevant in today’s cryptocurrency ecosystem where network congestion can lead to high transaction fees and delays. By leveraging CPFP, users can prioritize their important transactions without needing to increase the fee on the original transaction directly. Instead, they create a subsequent transaction that covers the remaining costs needed for confirmation.
How Does CPFP Work?
The core concept behind CPFP involves two separate but related transactions:
- Parent Transaction: The initial transfer of funds which may have been sent with a low fee or face delay due to network congestion.
- Child Transaction: A subsequent transfer that spends some of the same outputs from the parent transaction and includes higher fees designed specifically to incentivize miners.
When these two are broadcasted together into the network, miners see them as linked—since spending from one output depends on confirming both transactions—and thus tend to confirm them together. This process effectively "pays" for the parent’s confirmation by attaching higher fees through the child.
The key advantage here is flexibility: instead of increasing fees on an already broadcasted parent transaction—which might not be possible once it’s sent—you generate a new child transaction with sufficient fees attached. Miners then prioritize confirming both because doing so guarantees they receive higher overall rewards.
Practical Use Cases for CPFP
CPFP is especially useful in scenarios where users face urgent needs or limited funds:
Low-Fee Transactions Needing Confirmation: If someone sends Bitcoin with minimal fees during periods of high demand but needs their payment confirmed quickly—for example, in business dealings—they can create a child transaction paying higher fees.
Fee Management During Network Congestion: When many users compete for block space resulting in elevated fee levels, CPFP offers an alternative way to accelerate confirmation without waiting for network conditions to improve naturally.
Prioritizing Specific Transactions: Users managing multiple transfers may want certain payments confirmed faster than others; creating dedicated child transactions allows targeted prioritization based on urgency rather than blanket fee increases across all outgoing payments.
This approach enhances user control over how quickly their funds get confirmed while avoiding unnecessary expenditure on all pending transactions.
Impact of CPFP on Blockchain Network Health
Implementing CPFP contributes positively toward maintaining blockchain efficiency by reducing backlog and preventing bottlenecks caused by unconfirmed low-fee transactions. When users actively employ this method:
It encourages more dynamic fee strategies rather than static high-fee submissions.
It promotes fairer processing order based on actual economic incentives rather than arbitrary timing.
However, widespread use also introduces some challenges:
- Increased Complexity: Managing multiple linked transactions requires understanding how these mechanisms work—a potential barrier for less experienced users.
- Potential Scalability Concerns: As more complex multi-step processes emerge within blocks, there could be additional strain on nodes processing these linked data structures if not optimized properly.
- User Education Needs: To maximize benefits and avoid security risks like double-spending or misconfiguration errors, comprehensive user education remains essential.
Despite these challenges, when used correctly within best practices guidelines—such as those promoted by wallet providers—CPFP remains an effective tool for optimizing blockchain performance under varying conditions.
Recent Trends and Developments
Over recent years, adoption of Child-Pays-for-Parent has grown alongside increased awareness about efficient fee management strategies among Bitcoin users and developers alike. Notably:
Many modern wallets now support automatic creation of child transactions designed explicitly around this principle.
Developers continue refining protocols that facilitate easier implementation without requiring deep technical knowledge from end-users.
Furthermore, other cryptocurrencies like Litecoin have explored similar mechanisms inspired by Bitcoin's success with CPFP techniques — indicating broader industry recognition of its value beyond just Bitcoin networks.
As blockchain technology evolves towards scalability solutions such as Segregated Witness (SegWit) and Lightning Network implementations—which aim at reducing overall congestion—the role of methods like CPFP will likely adapt but remain relevant as supplementary tools during peak times or specific use cases requiring rapid confirmations.
By understanding how Child-Pays-for-Parent (CPFP) works—and recognizing its strategic importance—you gain insight into advanced yet practical methods available today for managing cryptocurrency transacting efficiently amidst fluctuating network conditions. Whether you're an individual user seeking quicker confirmations or part of broader efforts aiming at healthier blockchain ecosystems; mastering such techniques ensures smarter participation within decentralized financial systems while promoting fairness across participants worldwide.
Lo
2025-05-14 10:37
What are child-pays-for-parent (CPFP) transactions?
What Are Child-Pays-for-Parent (CPFP) Transactions?
Understanding CPFP Transactions in Cryptocurrency Networks
Child-Pays-for-Parent (CPFP) transactions are an innovative method used within Bitcoin and other blockchain networks to optimize transaction confirmation times and manage fees effectively. This technique allows a smaller, secondary transaction—called the child—to pay the necessary fees for a primary, or parent, transaction that might otherwise remain unconfirmed due to insufficient fee payments. Essentially, CPFP creates a link between two transactions so that miners are incentivized to confirm both simultaneously, ensuring faster processing of delayed or low-fee transactions.
This mechanism is particularly relevant in today’s cryptocurrency ecosystem where network congestion can lead to high transaction fees and delays. By leveraging CPFP, users can prioritize their important transactions without needing to increase the fee on the original transaction directly. Instead, they create a subsequent transaction that covers the remaining costs needed for confirmation.
How Does CPFP Work?
The core concept behind CPFP involves two separate but related transactions:
- Parent Transaction: The initial transfer of funds which may have been sent with a low fee or face delay due to network congestion.
- Child Transaction: A subsequent transfer that spends some of the same outputs from the parent transaction and includes higher fees designed specifically to incentivize miners.
When these two are broadcasted together into the network, miners see them as linked—since spending from one output depends on confirming both transactions—and thus tend to confirm them together. This process effectively "pays" for the parent’s confirmation by attaching higher fees through the child.
The key advantage here is flexibility: instead of increasing fees on an already broadcasted parent transaction—which might not be possible once it’s sent—you generate a new child transaction with sufficient fees attached. Miners then prioritize confirming both because doing so guarantees they receive higher overall rewards.
Practical Use Cases for CPFP
CPFP is especially useful in scenarios where users face urgent needs or limited funds:
Low-Fee Transactions Needing Confirmation: If someone sends Bitcoin with minimal fees during periods of high demand but needs their payment confirmed quickly—for example, in business dealings—they can create a child transaction paying higher fees.
Fee Management During Network Congestion: When many users compete for block space resulting in elevated fee levels, CPFP offers an alternative way to accelerate confirmation without waiting for network conditions to improve naturally.
Prioritizing Specific Transactions: Users managing multiple transfers may want certain payments confirmed faster than others; creating dedicated child transactions allows targeted prioritization based on urgency rather than blanket fee increases across all outgoing payments.
This approach enhances user control over how quickly their funds get confirmed while avoiding unnecessary expenditure on all pending transactions.
Impact of CPFP on Blockchain Network Health
Implementing CPFP contributes positively toward maintaining blockchain efficiency by reducing backlog and preventing bottlenecks caused by unconfirmed low-fee transactions. When users actively employ this method:
It encourages more dynamic fee strategies rather than static high-fee submissions.
It promotes fairer processing order based on actual economic incentives rather than arbitrary timing.
However, widespread use also introduces some challenges:
- Increased Complexity: Managing multiple linked transactions requires understanding how these mechanisms work—a potential barrier for less experienced users.
- Potential Scalability Concerns: As more complex multi-step processes emerge within blocks, there could be additional strain on nodes processing these linked data structures if not optimized properly.
- User Education Needs: To maximize benefits and avoid security risks like double-spending or misconfiguration errors, comprehensive user education remains essential.
Despite these challenges, when used correctly within best practices guidelines—such as those promoted by wallet providers—CPFP remains an effective tool for optimizing blockchain performance under varying conditions.
Recent Trends and Developments
Over recent years, adoption of Child-Pays-for-Parent has grown alongside increased awareness about efficient fee management strategies among Bitcoin users and developers alike. Notably:
Many modern wallets now support automatic creation of child transactions designed explicitly around this principle.
Developers continue refining protocols that facilitate easier implementation without requiring deep technical knowledge from end-users.
Furthermore, other cryptocurrencies like Litecoin have explored similar mechanisms inspired by Bitcoin's success with CPFP techniques — indicating broader industry recognition of its value beyond just Bitcoin networks.
As blockchain technology evolves towards scalability solutions such as Segregated Witness (SegWit) and Lightning Network implementations—which aim at reducing overall congestion—the role of methods like CPFP will likely adapt but remain relevant as supplementary tools during peak times or specific use cases requiring rapid confirmations.
By understanding how Child-Pays-for-Parent (CPFP) works—and recognizing its strategic importance—you gain insight into advanced yet practical methods available today for managing cryptocurrency transacting efficiently amidst fluctuating network conditions. Whether you're an individual user seeking quicker confirmations or part of broader efforts aiming at healthier blockchain ecosystems; mastering such techniques ensures smarter participation within decentralized financial systems while promoting fairness across participants worldwide.
Disclaimer:Contains third-party content. Not financial advice.
See Terms and Conditions.
How to Use RSI with Bollinger Bands for Effective Trading
Understanding how to combine technical indicators like the Relative Strength Index (RSI) and Bollinger Bands can significantly enhance your trading strategy, especially in volatile markets such as cryptocurrencies. Both tools provide unique insights—RSI measures momentum, while Bollinger Bands assess market volatility. When used together, they offer a comprehensive view of potential entry and exit points, helping traders make more informed decisions.
What Is RSI and How Does It Work?
The Relative Strength Index (RSI), developed by J. Welles Wilder, is a momentum oscillator that quantifies the speed and change of price movements over a specified period—commonly 14 days. The RSI ranges from 0 to 100; readings above 70 suggest an asset may be overbought, indicating a possible price correction or reversal downward. Conversely, readings below 30 imply oversold conditions that could precede an upward rebound.
Traders often use RSI to identify potential trend reversals or confirm existing trends. Its sensitivity can be adjusted by changing the period length: shorter periods (like 7 days) make it more reactive but prone to false signals; longer periods (such as 28 days) smooth out fluctuations but may lag behind current market conditions.
Understanding Bollinger Bands and Their Role in Volatility Analysis
Bollinger Bands consist of three components: a simple moving average (middle band) and two outer bands set at standard deviations away from this average—typically two standard deviations for each band. These bands expand during high volatility periods and contract when markets are calmer.
By observing where prices are relative to these bands, traders gain insights into market strength and potential breakout points:
- When prices approach or touch the upper band, it indicates strong upward momentum but also suggests overbought conditions.
- When prices near the lower band signal oversold levels with potential for upward movement.
- Narrowing bands often precede significant price moves due to low volatility phases setting up breakouts.
Combining RSI with Bollinger Bands: A Strategic Approach
Integrating RSI with Bollinger Bands allows traders to refine their signals by confirming momentum alongside volatility cues:
Identifying Overbought/Oversold Conditions
- An asset showing an RSI above 70 coupled with its price near or touching the upper Bollinger Band suggests strong buying pressure but also warns of possible exhaustion—a signal that a pullback might occur soon.
- Conversely, when RSI dips below 30 while prices hover near or at the lower band indicates overselling—potentially signaling an upcoming bounce or reversal.
Spotting Potential Entry Points
- A common tactic involves looking for instances where both indicators align: such as an oversold RSI (<30) combined with prices at the lower band could present a buy opportunity.
- Similarly, overbought signals (>70 on RSI) paired with upper-band proximity might indicate it's time to consider selling or taking profits.
Confirming Breakouts
- Breakouts beyond either bollinger band accompanied by extreme RSI levels can validate strong directional moves.
- For example, if price breaks above the upper band while RSI remains high (>70), it might signify continued bullishness rather than just temporary overextension—a cue for aggressive entries if confirmed further through volume analysis.
Practical Trading Strategies Using Both Indicators
Several strategies leverage this combination effectively:
RSI-Bollinger Band Crossover Strategy:
This involves entering trades when specific thresholds are crossed—for instance:- Buying when RSIs cross below 30 near the lower bollinger band
- Selling when RSIs cross above 70 near the upper bollinger band
Breakout Strategy:
Monitoring for breakouts beyond bands:- Enter long positions if price breaks out upwards past the upper bolliger band while RSIs stay elevated
- Enter short positions on downward breakouts past lower bands combined with low RSIs
These strategies benefit from confirming signals across both indicators before executing trades — reducing false positives common in volatile markets like cryptocurrencies.
Adjusting Indicator Settings for Better Results
Fine-tuning parameters enhances indicator responsiveness:
- For RSI, shorter periods increase sensitivity but risk more false signals; longer periods provide stability at expense of lagging behind rapid moves.
- For Bollinger Bands, increasing standard deviation widens bands during high-volatility phases; decreasing makes them tighter during calmer markets — aiding in detecting subtle shifts versus major breakouts.
Experimentation based on your trading timeframe and asset class is essential for optimal results without sacrificing reliability.
Risks & Limitations of Using Both Indicators Together
While combining RSI and Bollinger Bands offers valuable insights—and improves trade accuracy—it’s not foolproof:
- Both tools can generate false signals during highly volatile swings where rapid reversals occur unexpectedly.
- Overreliance on technical indicators without considering fundamental factors may lead you astray—especially in news-driven markets like cryptocurrencies.
- Market conditions influence effectiveness; trending markets tend to produce clearer signals than sideways consolidations where whipsaws are frequent.
To mitigate these risks, incorporate additional analysis methods such as volume confirmation or trend-following tools alongside your primary indicators.
Enhancing Your Trading Strategy With Technical Indicator Synergy
Using RSI in conjunction with Bollinger Bands provides traders a layered perspective—momentum coupled with volatility—that helps identify high-probability trade setups. By understanding how each indicator behaves individually—and how they interact—you can develop disciplined entry/exit rules aligned closely with current market dynamics.
In practice:
- Look for confluence between low/high RSIs and proximity to respective bolliger bands
- Confirm breakout validity through volume spikes
- Adjust indicator settings based on your preferred trading timeframe
Remember always to test strategies thoroughly before applying them live—and combine technical insights within broader risk management frameworks—to maximize success chances across different market environments.
JCUSER-F1IIaxXA
2025-05-09 09:27
How can RSI be used in conjunction with Bollinger Bands?
How to Use RSI with Bollinger Bands for Effective Trading
Understanding how to combine technical indicators like the Relative Strength Index (RSI) and Bollinger Bands can significantly enhance your trading strategy, especially in volatile markets such as cryptocurrencies. Both tools provide unique insights—RSI measures momentum, while Bollinger Bands assess market volatility. When used together, they offer a comprehensive view of potential entry and exit points, helping traders make more informed decisions.
What Is RSI and How Does It Work?
The Relative Strength Index (RSI), developed by J. Welles Wilder, is a momentum oscillator that quantifies the speed and change of price movements over a specified period—commonly 14 days. The RSI ranges from 0 to 100; readings above 70 suggest an asset may be overbought, indicating a possible price correction or reversal downward. Conversely, readings below 30 imply oversold conditions that could precede an upward rebound.
Traders often use RSI to identify potential trend reversals or confirm existing trends. Its sensitivity can be adjusted by changing the period length: shorter periods (like 7 days) make it more reactive but prone to false signals; longer periods (such as 28 days) smooth out fluctuations but may lag behind current market conditions.
Understanding Bollinger Bands and Their Role in Volatility Analysis
Bollinger Bands consist of three components: a simple moving average (middle band) and two outer bands set at standard deviations away from this average—typically two standard deviations for each band. These bands expand during high volatility periods and contract when markets are calmer.
By observing where prices are relative to these bands, traders gain insights into market strength and potential breakout points:
- When prices approach or touch the upper band, it indicates strong upward momentum but also suggests overbought conditions.
- When prices near the lower band signal oversold levels with potential for upward movement.
- Narrowing bands often precede significant price moves due to low volatility phases setting up breakouts.
Combining RSI with Bollinger Bands: A Strategic Approach
Integrating RSI with Bollinger Bands allows traders to refine their signals by confirming momentum alongside volatility cues:
Identifying Overbought/Oversold Conditions
- An asset showing an RSI above 70 coupled with its price near or touching the upper Bollinger Band suggests strong buying pressure but also warns of possible exhaustion—a signal that a pullback might occur soon.
- Conversely, when RSI dips below 30 while prices hover near or at the lower band indicates overselling—potentially signaling an upcoming bounce or reversal.
Spotting Potential Entry Points
- A common tactic involves looking for instances where both indicators align: such as an oversold RSI (<30) combined with prices at the lower band could present a buy opportunity.
- Similarly, overbought signals (>70 on RSI) paired with upper-band proximity might indicate it's time to consider selling or taking profits.
Confirming Breakouts
- Breakouts beyond either bollinger band accompanied by extreme RSI levels can validate strong directional moves.
- For example, if price breaks above the upper band while RSI remains high (>70), it might signify continued bullishness rather than just temporary overextension—a cue for aggressive entries if confirmed further through volume analysis.
Practical Trading Strategies Using Both Indicators
Several strategies leverage this combination effectively:
RSI-Bollinger Band Crossover Strategy:
This involves entering trades when specific thresholds are crossed—for instance:- Buying when RSIs cross below 30 near the lower bollinger band
- Selling when RSIs cross above 70 near the upper bollinger band
Breakout Strategy:
Monitoring for breakouts beyond bands:- Enter long positions if price breaks out upwards past the upper bolliger band while RSIs stay elevated
- Enter short positions on downward breakouts past lower bands combined with low RSIs
These strategies benefit from confirming signals across both indicators before executing trades — reducing false positives common in volatile markets like cryptocurrencies.
Adjusting Indicator Settings for Better Results
Fine-tuning parameters enhances indicator responsiveness:
- For RSI, shorter periods increase sensitivity but risk more false signals; longer periods provide stability at expense of lagging behind rapid moves.
- For Bollinger Bands, increasing standard deviation widens bands during high-volatility phases; decreasing makes them tighter during calmer markets — aiding in detecting subtle shifts versus major breakouts.
Experimentation based on your trading timeframe and asset class is essential for optimal results without sacrificing reliability.
Risks & Limitations of Using Both Indicators Together
While combining RSI and Bollinger Bands offers valuable insights—and improves trade accuracy—it’s not foolproof:
- Both tools can generate false signals during highly volatile swings where rapid reversals occur unexpectedly.
- Overreliance on technical indicators without considering fundamental factors may lead you astray—especially in news-driven markets like cryptocurrencies.
- Market conditions influence effectiveness; trending markets tend to produce clearer signals than sideways consolidations where whipsaws are frequent.
To mitigate these risks, incorporate additional analysis methods such as volume confirmation or trend-following tools alongside your primary indicators.
Enhancing Your Trading Strategy With Technical Indicator Synergy
Using RSI in conjunction with Bollinger Bands provides traders a layered perspective—momentum coupled with volatility—that helps identify high-probability trade setups. By understanding how each indicator behaves individually—and how they interact—you can develop disciplined entry/exit rules aligned closely with current market dynamics.
In practice:
- Look for confluence between low/high RSIs and proximity to respective bolliger bands
- Confirm breakout validity through volume spikes
- Adjust indicator settings based on your preferred trading timeframe
Remember always to test strategies thoroughly before applying them live—and combine technical insights within broader risk management frameworks—to maximize success chances across different market environments.
Disclaimer:Contains third-party content. Not financial advice.
See Terms and Conditions.